
See how profitability unfolds over time with the Loss Ratio Curve Analytics Tool.
The tool takes your earned premium and claims data and turns it into clear, time-aligned curves that show how loss ratios develop month by month. Every record is aligned from Month 1 forward, so you can see true performance by vintage, product, dealer, or any segment in your file.
Use the Loss Ratio Curve Analytics Tool to:
- Measure profitability by vintage, product line, agent, or dealer
- Compare earning methods—Pro Rata, Rule of 78s, Reverse 78s, or your own custom curve
- Spot loss emergence trends early and tighten pricing or reserving
- Benchmark results across administrators, dealer groups, or warranty types
No actuarial work. No modeling. Just upload your Excel file and see the curve.
No code. No waiting. Just clarity.

Easy to Use Loss Ratio Curve
- Upload your Excel file
- Choose your filters
- View the graph instantly
- Download your results
No coding. No formulas. No data science degree required.
Just fast, clear answers—ready in seconds.
Step 1: Upload and Set Fields

Drop in your Excel —no formatting required.
Big files? No problem. Just make sure the data is in the first tab.
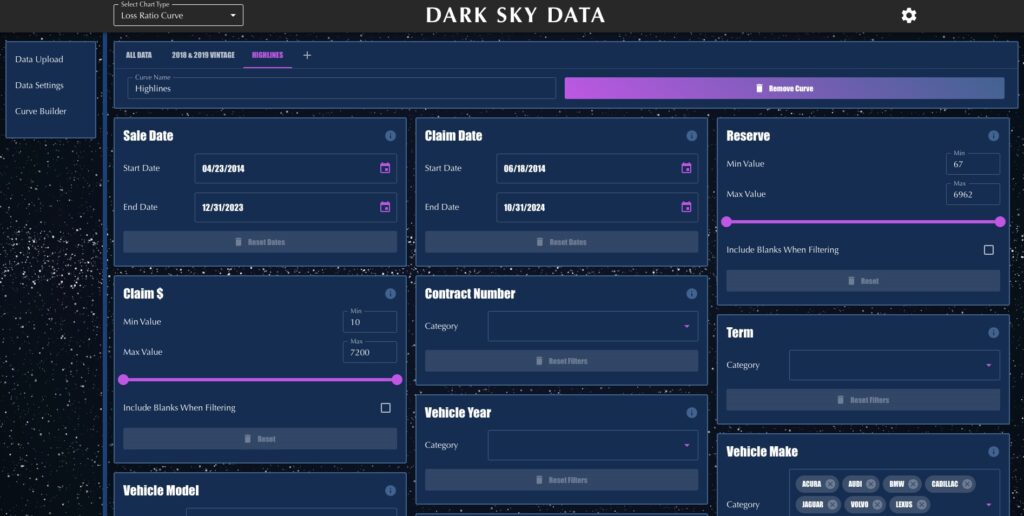
Step 2: SET FILTERS
Turn any column into a filter.
Compare loss ratios by make/model/year, product, state, vintage, or any other column in your dataset.
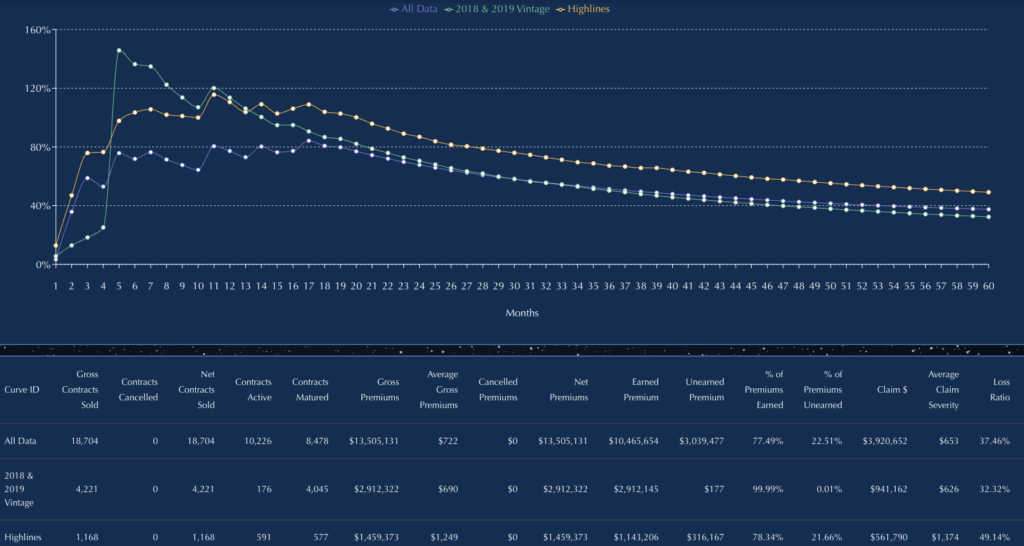 Step 3: Build Curves
The curve builds itself—automatically and instantly.
Hover to reveal exact values with interactive tooltips.
Compare up to five filtered curves side-by-side, ready to explore or export.