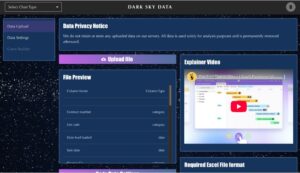
Balance Curves
Track how balances move over time—by contract, loan, policy, or client account.
Balance Curves turn raw data into clear, time-aligned visuals that show how value shifts across a cohort—month by month. The tool can be used to track both balance decline (paydown) and balance accumulation (build) over time, aligning each record to Month 1, Month 2, and beyond from the point of origination.
Use it to see how loan balances decline across vintages—or how client AUM grows over time by segment. Whether you’re analyzing financing performance, deposit inflows, or recurring billing behavior, Balance Curves deliver insight without the modeling headache.
No code. No complex setup. Just a clean, intuitive interface and your Excel file.
We never store your data—uploads are processed in-session only and permanently deleted after each use.
Use Cases
Benefits
TIME
Build a Balance Curve with filters in under 60 seconds
Skip the 10+ hours it takes to do it manually in Excel
ACCURACY
Remove human error with automated calculations
Trust every curve—logic is transparent and repeatable
FLEXIBILITY
Filter on any field in your dataset
Works with your structure—no need to reformat files
How It Works
Step 1: Upl
oad
Drop in your Excel —no formatting required.
Big files? No problem. Just make sure the data is in the first tab.
Step 2: SET FIELDS AND FILTERS
Turn any column into a filter.
Compare paydown curves by channel, state, product—even 18 month loans by interest rate in Texas.
Step 3: Build Curves
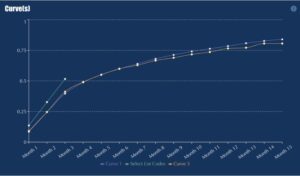
The curve builds itself—automatically and instantly.
Hover to reveal exact values with interactive tooltips.
Compare up to five filtered curves side-by-side, ready to explore or export.