
What earnings curves are used in the F&I industry?
An earnings curve determines how revenue is recognized over time for an F&I contracts, such as VSCs, windshield, PDR, appearance protection, and tire & wheel. The method you choose directly affects reported loss ratios, reserving, valuation, and timing of earnings and cash flow. The four most common earnings curve methodologies are:
- Rule of 78s
- Reverse rule of 78s
- Pro rata
- Experience based
Below is guidance on when and why each is used.
|
Month
|
Rule of
78s Weight
|
Rule of
78s %
|
Reverse Rule of
78s Weight
|
Reverse Rule
of 78s %
|
Pro Rata
%
|
|---|---|---|---|---|---|
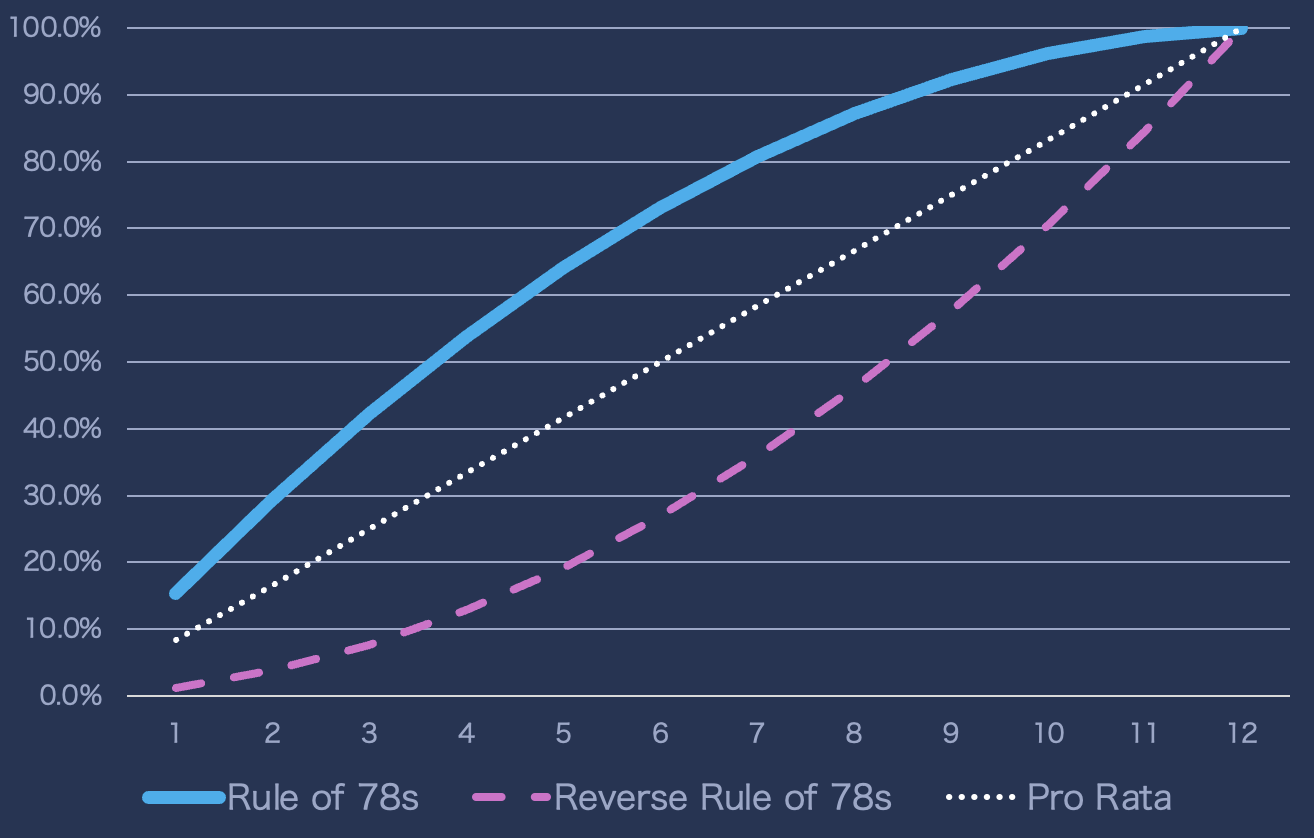
| 1 | 12 | 15.38% | 1 | 1.28% | 8.33% |
| 2 | 11 | 14.10% | 2 | 2.56% | 8.33% |
| 3 | 10 | 12.82% | 3 | 3.85% | 8.33% |
| 4 | 9 | 11.54% | 4 | 5.13% | 8.33% |
| 5 | 8 | 10.26% | 5 | 6.41% | 8.33% |
| 6 | 7 | 8.97% | 6 | 7.69% | 8.33% |
| 7 | 6 | 7.69% | 7 | 8.97% | 8.33% |
| 8 | 5 | 6.41% | 8 | 10.26% | 8.33% |
| 9 | 4 | 5.13% | 9 | 11.54% | 8.33% |
| 10 | 3 | 3.85% | 10 | 12.82% | 8.33% |
| 11 | 2 | 2.56% | 11 | 14.10% | 8.33% |
| 12 | 1 | 1.28% | 12 | 15.38% | 8.33% |
1. What is the Pro-Rata (Straight-Line) earnings method?
Short Answer: Pro-Rata earns revenue evenly over the life of a contract, regardless of claim activity.
When it’s used: By administrators or insurers seeking a simple, conservative method.
Benefits:
- Very easy to implement and audit
- Matches time-based exposure, not actual claims
Downsides:
- Misaligns with real-world claims, which often occur earlier in the contract
2. What is the Rule of 78s earnings method?
Short Answer: The Rule of 78s front-loads revenue, recognizing more in early months and less later.
When it’s used: Dealer-obligor programs, reinsurance structures, or when early cancellation risk is high.
Benefits:
- Matches common refund patterns (heavier early cancellations)
- Can front-load profit for early cash return
Downsides:
- Overstates profitability early
- Doesn’t reflect true claims exposure over time
3. What is the Reverse Rule of 78s method?
Short Answer: Reverse Rule of 78s back-loads earnings to match rising claims frequency over time.
When it’s used: New vehicle sales because the OEM warranty covers losses and in programs with higher claims toward the end (e.g., high-mileage or long-term VSCs).
Benefits:
- Matches actual claims emergence
- Helps present a more accurate loss ratio profile
Downsides:
- Suppresses early earnings
- May delay reported profitability
4. What is a Claims-Based or Experience Curve?
Short Answer: A claims-based curve uses historical data to match earnings to actual loss patterns.
When it’s used: By large administrators, MGAs, or insurers with the data and tools to model loss cost accurately.
Benefits:
- Most accurate method for loss ratios and reserving
- Compliant with GAAP and preferred by auditors
Downsides:
- Requires significant historical data
- More complex to build and maintain
At Dark Sky Data, we offer custom-built Experience Curves based on your real-world claims history—by product type, region, and cohort.
Summary: Which earnings curve is right for you?
|
Method
|
Best for
|
Pros
|
Cons
|
|---|---|---|---|
| Pro-Rata | Simplicity & conservative filings | Easy to apply; matches time, not claims | Doesn’t reflect actual claim activity |
| Rule of 78s | Dealer-obligor or early refunds | Matches cancellations; accelerates earnings | Front-loads revenue; mismatches claims |
| Reverse Rule of 78s | Back-loaded risk profiles | Reflects delayed claims emergence | Delays early earnings |
| Experience / Claims-Based | Accurate loss ratios & valuation | Data-driven and audit-ready | Requires modeling and historical data |
| Want help selecting or modeling your earnings curve? Dark Sky Data makes it easy—just upload your data and we’ll build a claims-aligned curve for you. | |||