
ANALYZE HOW RETENTION CHANGES OVER TIME.
The Retention Analysis Tool helps teams visualize how customers, accounts, and recurring revenue persist across time. Instead of relying on blended retention metrics, the platform aligns cohorts to a shared starting point so you can identify where retention strengthens, weakens, stabilizes, or deteriorates.
Customer retention is one of the clearest indicators of cash flow durability. Whether you're evaluating a portfolio company, managing a recurring revenue business, or monitoring performance across multiple locations, retention behavior reveals whether growth is being driven by durable customer relationships or constant replacement through new acquisition.
Whether you are analyzing SaaS subscriptions, HVAC service agreements, recurring revenue businesses, retail customers, or private equity portfolio companies, the tool helps surface retention behavior across subsidiaries, branches, acquisition cohorts, service regions, and operational segments.
In just a few steps, teams can move from spreadsheet to retention intelligence:
• Upload your Excel file
• Configure your inactivity window and minimum activity threshold
• Filter and compare retention performance across segments
• Export the results directly to Excel
Spot early churn. Compare cohort durability. Identify retention deterioration before it appears in aggregate KPIs, financial reporting, or diligence processes.
Your data is never stored. Uploads are processed in-session and permanently deleted after each use.
Why Retention Matters
 Customer retention is a proxy for the quality and durability of a business's cash flows—the foundation of every valuation model, lender underwriting decision, and exit process.
Retained customers generate recurring revenue with little to no acquisition cost. Strong retention improves revenue predictability, validates customer lifetime value assumptions, and helps explain whether a business is earning customers through product value or continuously replacing customers through new acquisition.
Blended retention metrics often conceal underlying deterioration. New customer acquisition can mask customer losses for months or years before the impact appears in financial reporting. Cohort-based retention analysis reveals whether newer customer groups retain as well as older cohorts, helping identify weakening customer behavior before it becomes visible in aggregate KPIs.
For private equity firms and company leadership teams, retention analysis is not simply an operating metric. It is evidence of whether growth is durable, repeatable, and defensible.
Step 1: Upload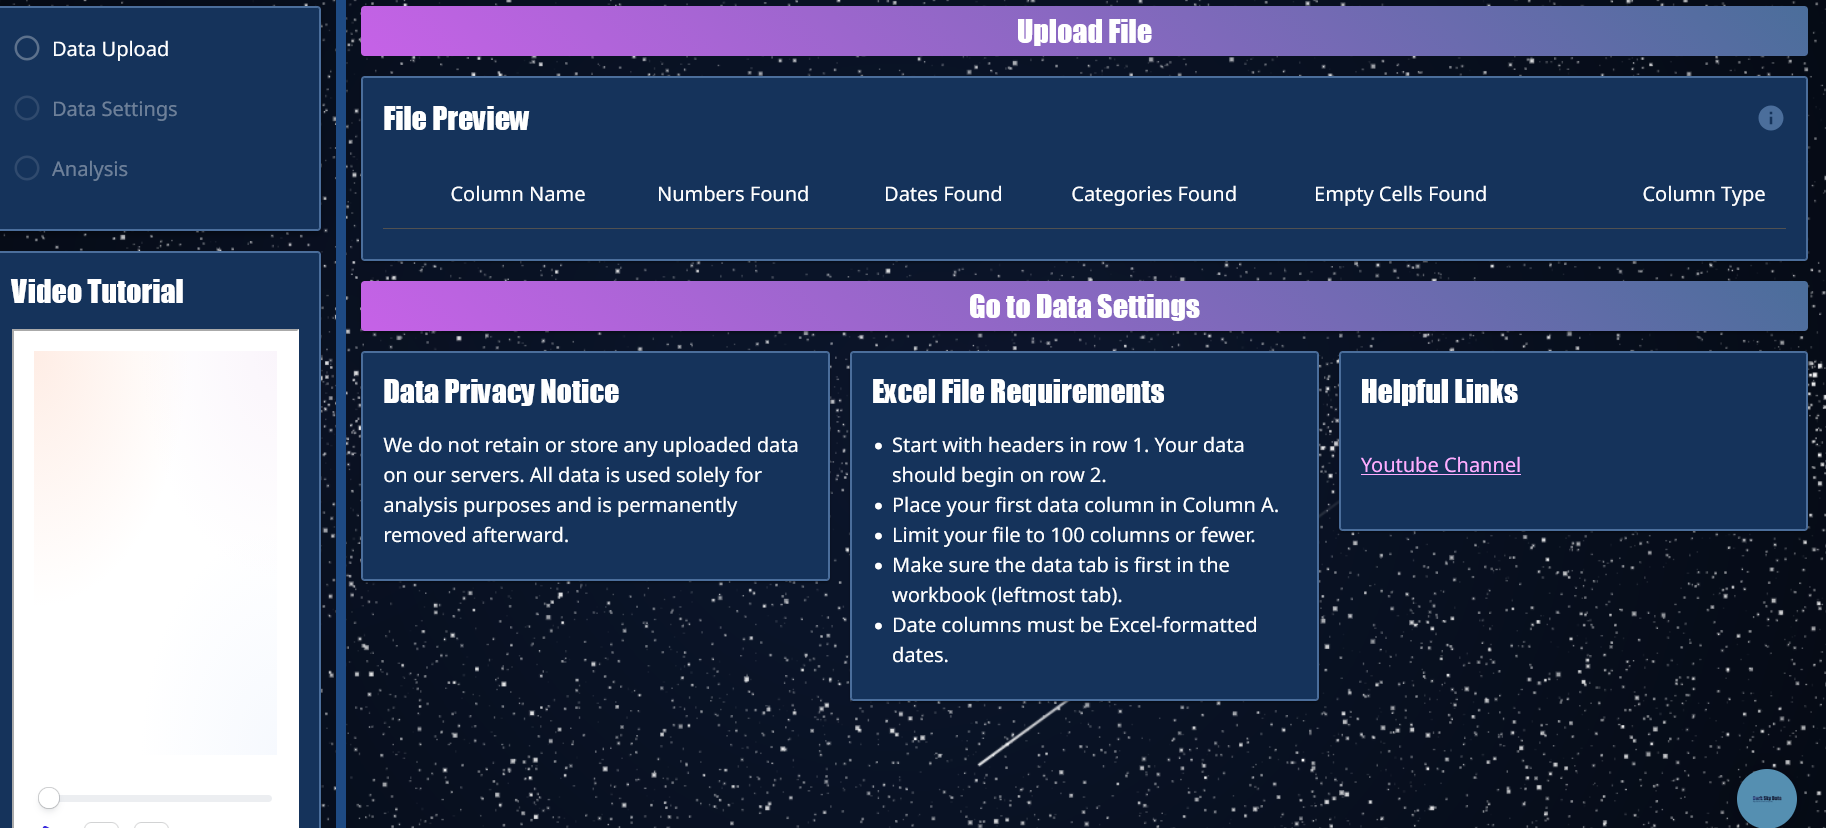
Drop in your Excel —no formatting required.
Big files? No problem. Just make sure the data is in the first tab.
Not sure what to upload? Use our example data.
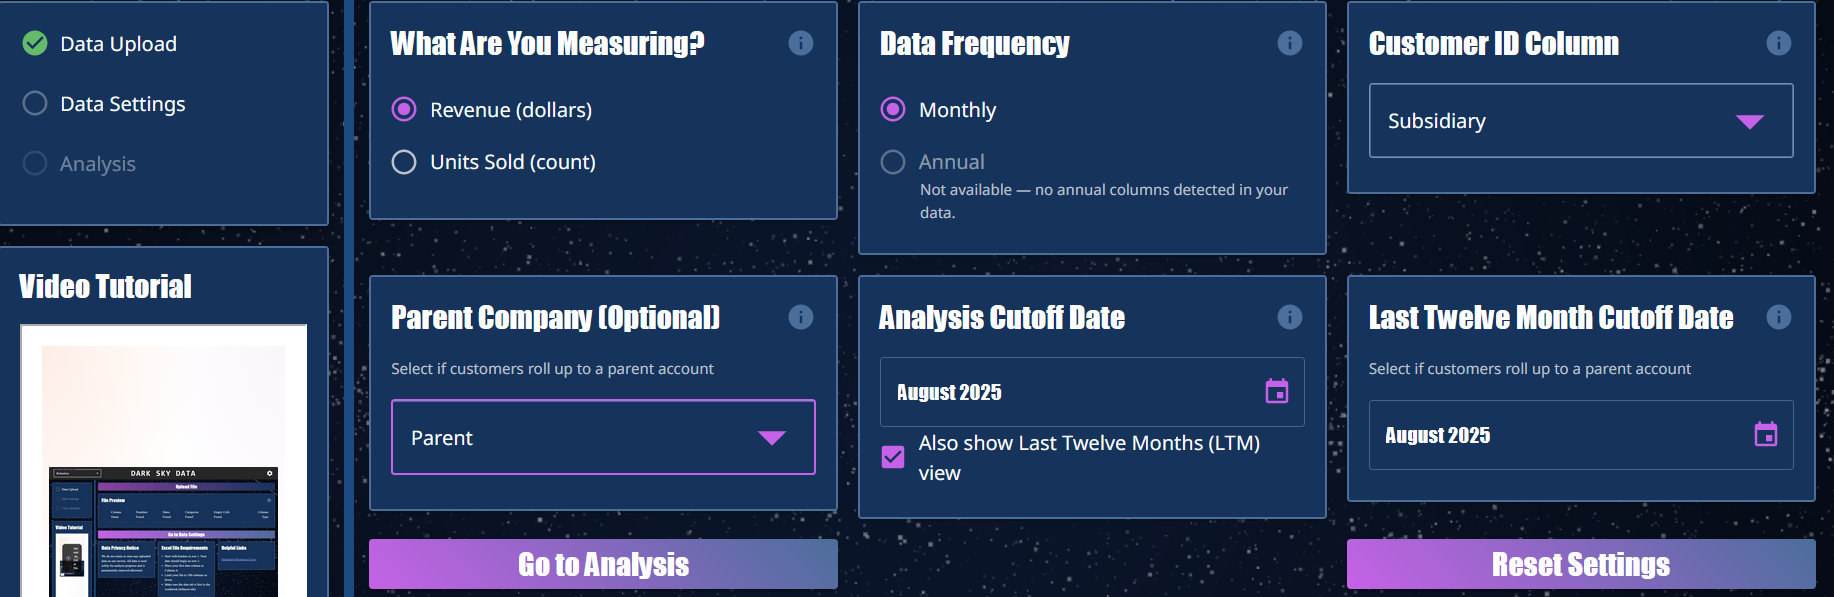
Step 2: SET FIELDS AND FILTERS
Turn any column into a filter.
Compare retention by channel, product, geography, or customer segment.
Step 3: GENERATE RESULTS
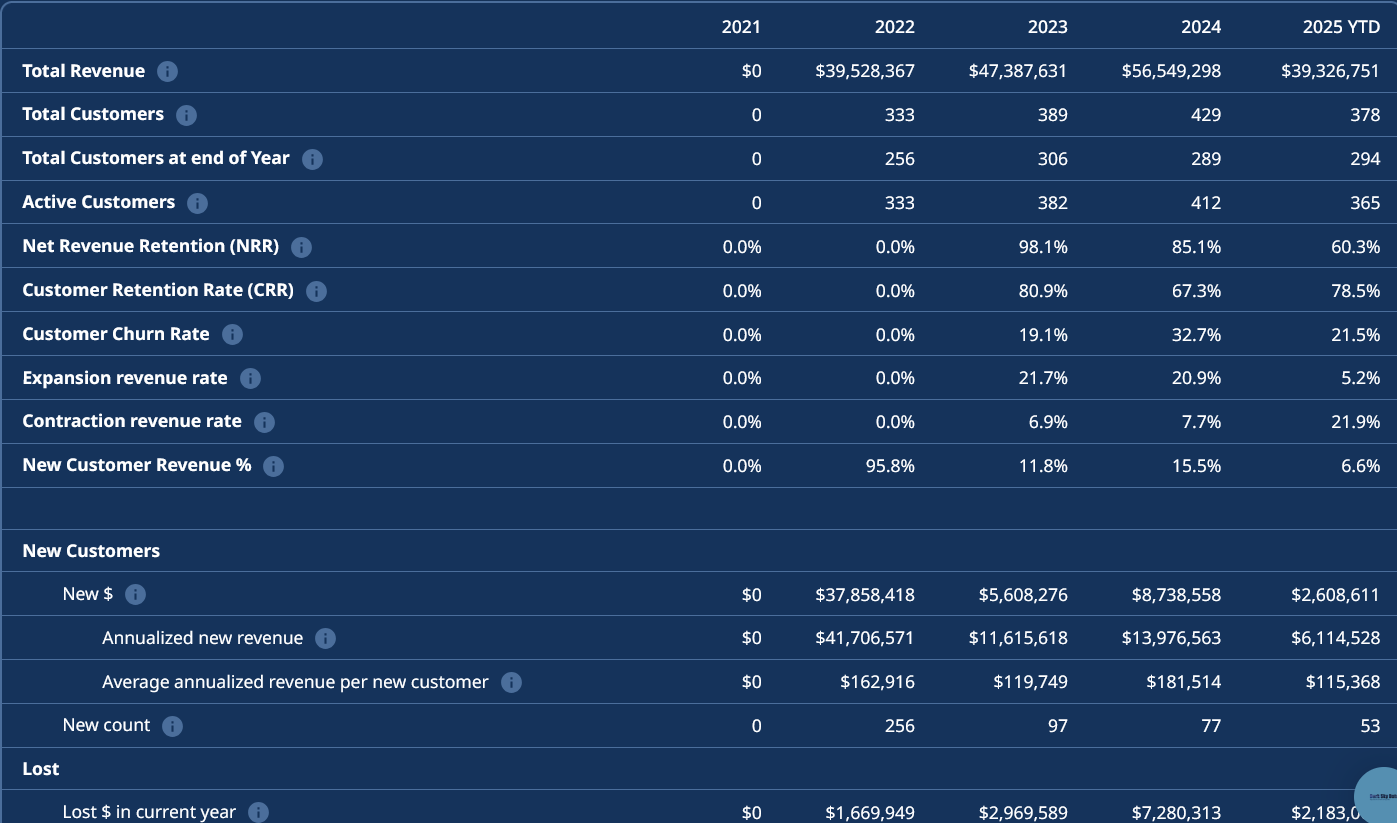
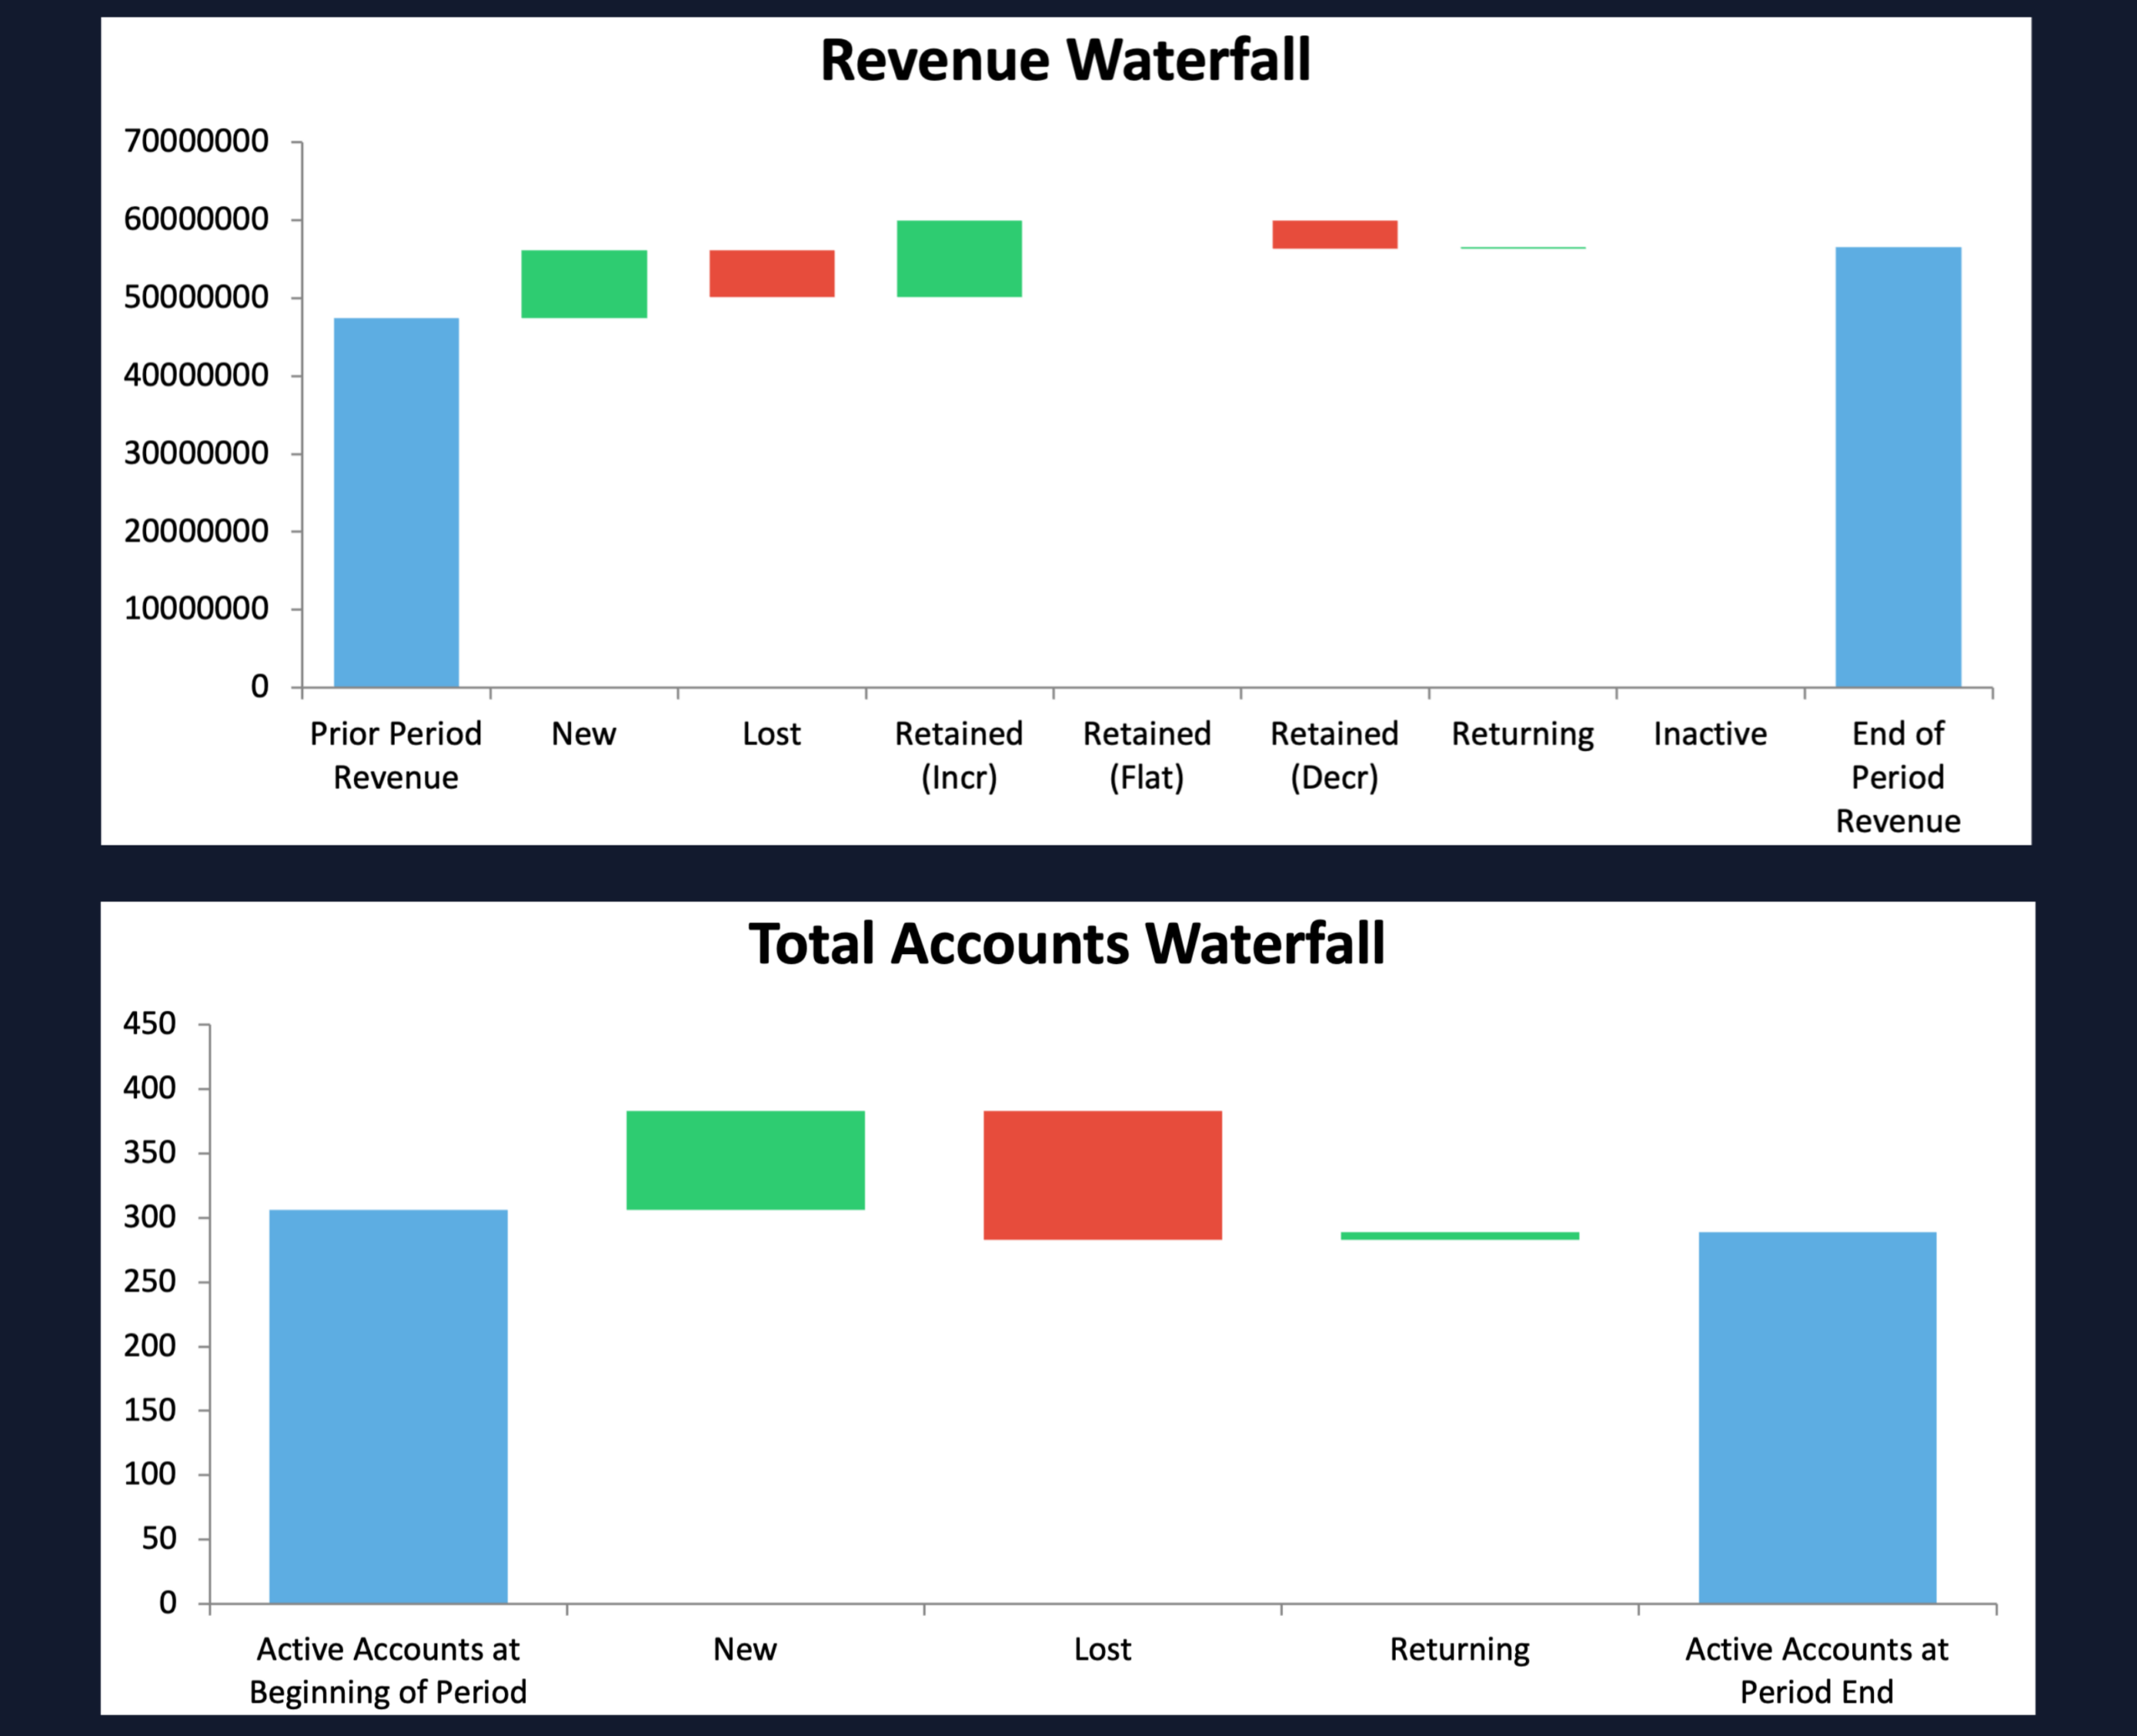
Retention metrics populate automatically based on your filters and cohort selections.
Hover to inspect exact values with interactive tooltips and detailed retention breakdowns.
Compare retention performance across segments, analyze customer persistence over time, and export the results directly to Excel.
RETENTION IS ONLY AS ACCURATE AS ITS DEFINITION
Most retention tools assume a fixed definition of customer activity. Real customer behavior rarely fits a fixed definition.
A SaaS customer who misses two subscription payments may be lost. An HVAC customer who has not scheduled service in eight months may still be active. A single small transaction may not represent meaningful customer engagement. Applying the same retention logic across every business can distort customer classifications, churn rates, and retention metrics.
The Retention Analysis Tool allows teams to define both the minimum sale required for a customer to be considered active and the number of months that must pass before a customer is classified as lost. Adjusting these settings instantly updates customer classifications, retention metrics, churn rates, and cohort analysis across the entire dataset.
This helps ensure retention is measured according to how the business actually operates—not a one-size-fits-all definition.
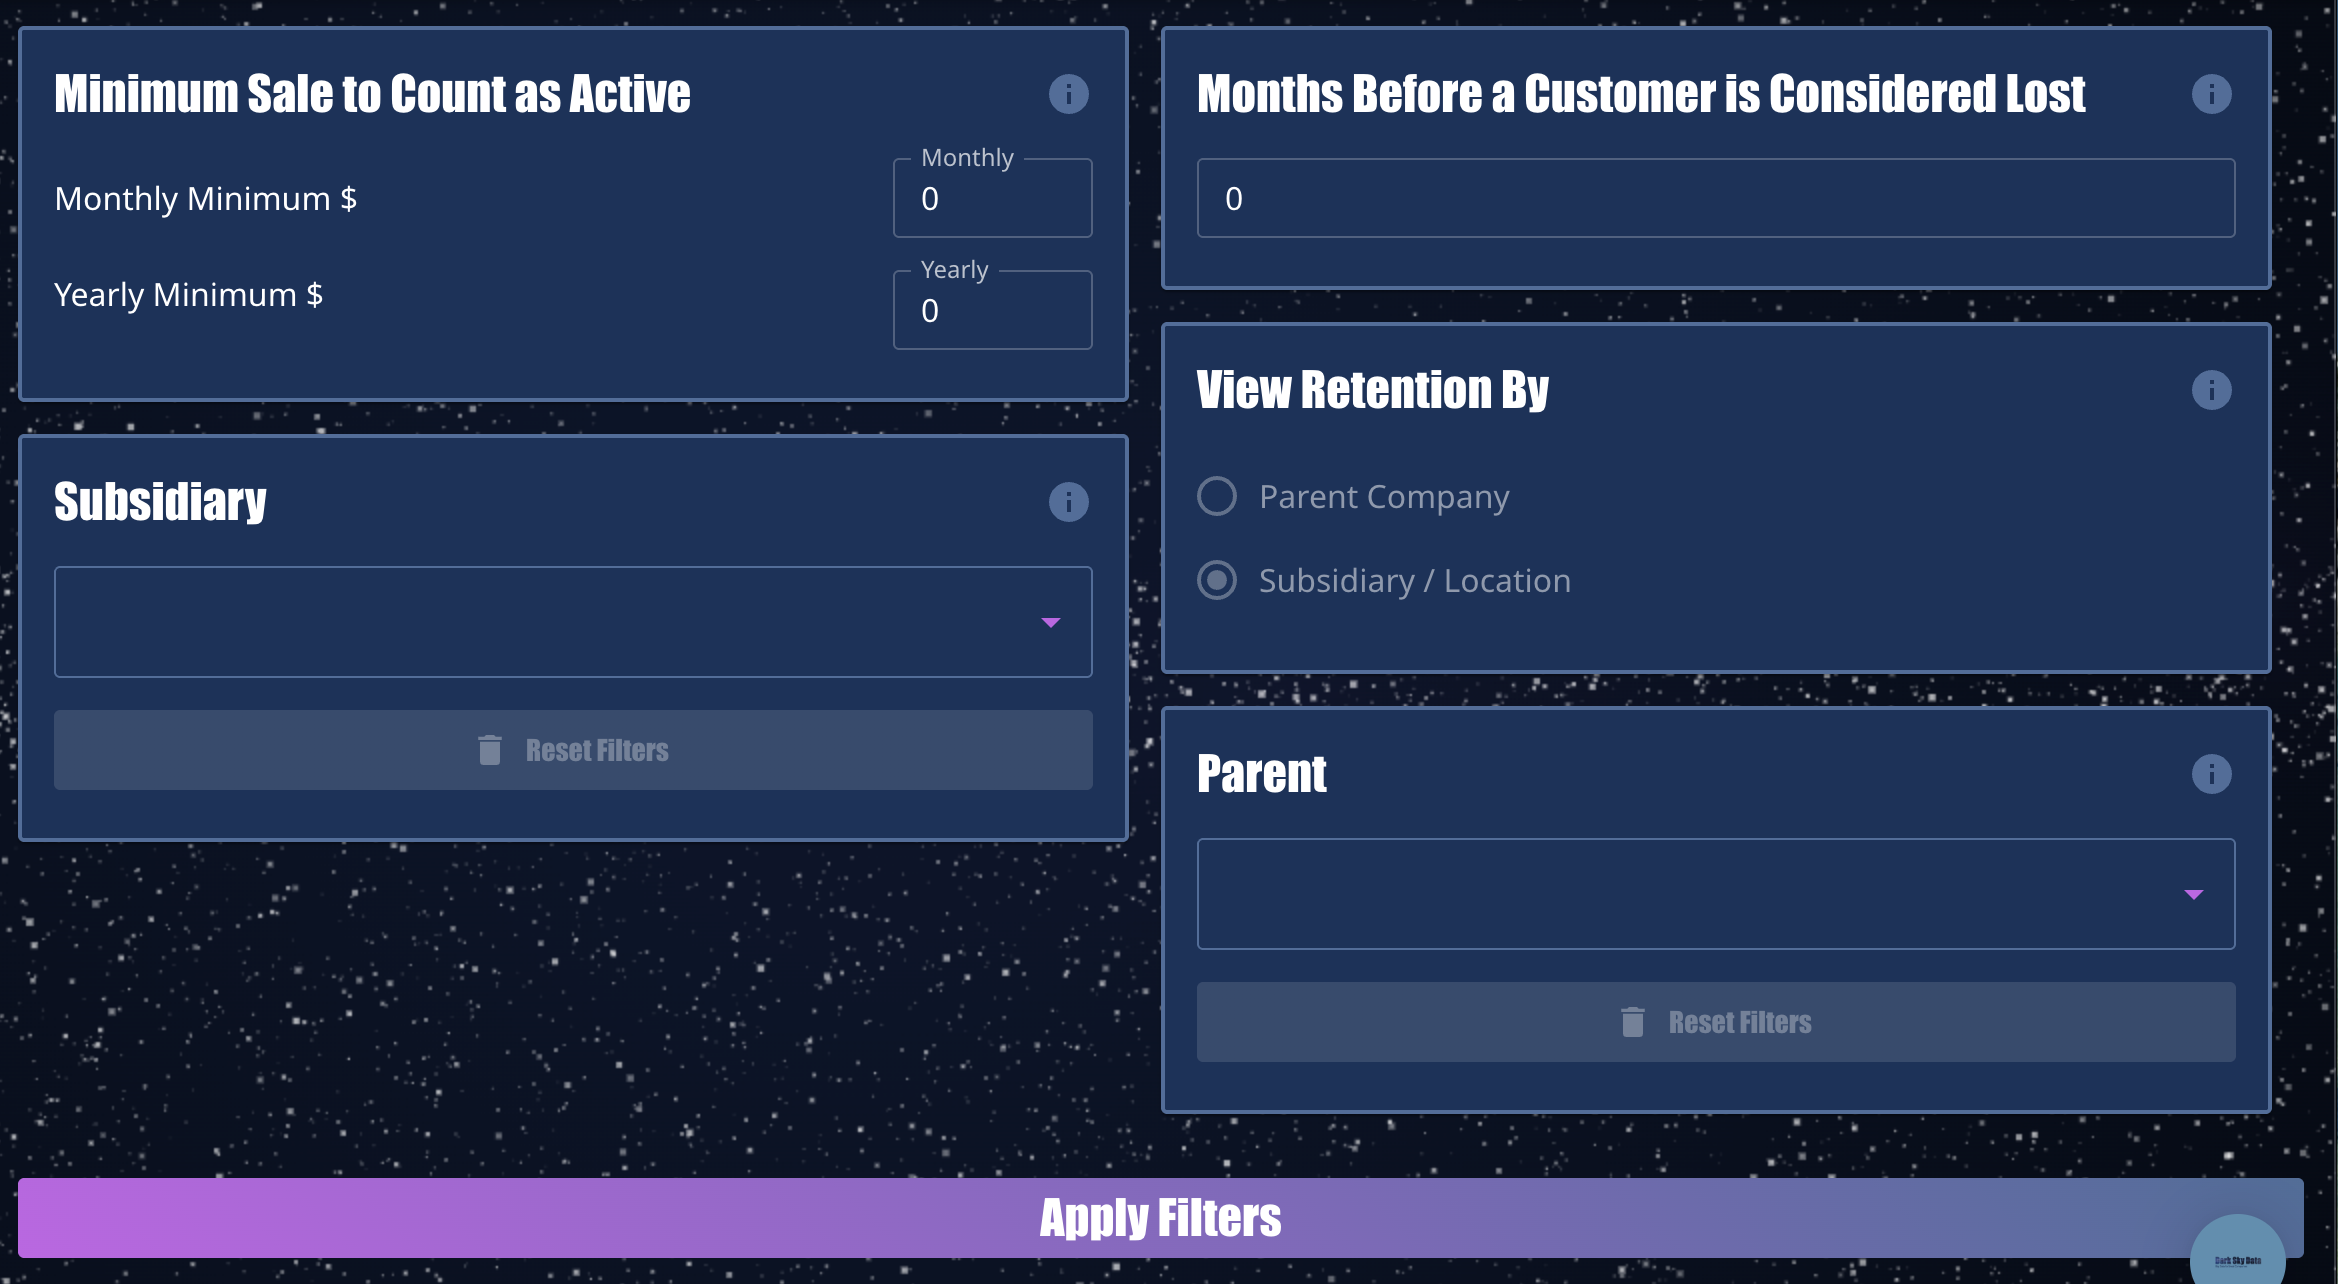
MINIMUM SALE TO COUNT AS ACTIVE
Define the minimum revenue threshold required for a customer to be considered active. This prevents small transactions from artificially inflating retention metrics and ensures activity reflects meaningful customer engagement rather than isolated purchases.
MONTHS BEFORE A CUSTOMER IS CONSIDERED LOST
Define how many months must pass before a customer is classified as lost. A customer who skips one billing cycle may be inactive, while a customer with no activity for six months may be churned. The appropriate definition depends on the business model, customer buying cycle, and revenue pattern.
WHY IT MATTERS
Small changes to these assumptions can materially impact churn rates, retention rates, customer lifetime value calculations, and cohort performance. Making those assumptions transparent and configurable helps ensure retention metrics reflect business reality rather than spreadsheet conventions.