VSC Cancellation Curve: See What’s Costing You—and Fix It Fast

How an Improved VSC Cancellation Curve Drops Profit to the Bottom Line

Even a small improvement in your VSC Cancellation Curve drops straight to the bottom line.

Look at the example. Just a 4-point reduction in cancellations—from 52% to 48%—could mean an extra $100,000 in profit every month for every 1,000 contracts sold, or $1.2 million a year.

That’s because early cancels don’t just erase margin—they trigger chargebacks, inflate reserve rates, and choke off marketing reinvestment. A steeper curve means cash flow pain. A flatter one? More money in your pocket, faster.

If you’re not tracking your VSC Cancellation Curve yet, you’re flying blind. The right insights—filtered by lead, call center rep, product type, or term—can show you exactly where you’re bleeding and how to stop it.

52%
Cancellation Rate
48%
Cancellation Rate
VSC Customer Price $4,000 $4,000
Admin Fee & Payment Plan Fee
$1,500
$1,500
Profit Before Cancel Reserve $2,500 $2,500
Payment Plan Reserve $1,300 $1,200
Reserve Rate
52%
48%
Funded to Marketer $1,200 $1,300
CPA
$600
$600
Profit per Contract $600 $700
Monthly Contracts Sold 1,000 1,000
Monthly Profit $600,000 $700,000
Annual Impact $1.2 million

Why Cancellations Matter More Than You Think

If you’re marketing VSCs, you already know: early cancels are brutal. They kill your margin, blow up your reserve, and choke your cash flow. That’s why your VSC Cancellation Curve matters.

A modern astronaut repairs a spacecraft labeled “Cash Flow,” capturing how early cancellations in VSC contracts drain profitability and reserve funding.

Think about it—if your CPA is $600, you don't recoup your spend until Month 6. Early cancels don’t just sting—they could break you.

And it’s not just about margin. Your payment plan company is watching. They set your reserve based on how your contracts have canceled in the past. If your curve shows a steep drop early on? You’ll get funded less. Worse yet, they could require you increase your reserve balance immediately with a cash infusion.

Fewer early cancellations = lower reserve = more cash upfront.

So… don’t you want to know what’s driving the cancels?

  • Is it your down payment options?

  • Is it Jesse in the call center?

  • Is one lead provider tanking your quality?

  • Is there one state or product that’s spiking?

The VSC Cancellation Curve shows you where the losses are hiding—so you can fix them, prove it, and get paid more.

Interpreting the VSC Cancellation Curve

Most marketers look at cancellation rates in the current month. But a VSC Cancellation Curve shows something different—it reveals the timing of cancels, aligned across cohorts. Whether a contract starts in June 2023 or November 2024, both show up as Month 1 on the curve. That way, you can compare behavior apples-to-apples.


HIGH MONTH 1 CANCELS

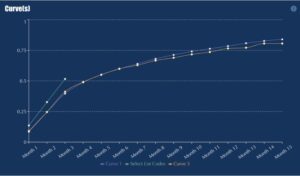
Your customers are cancelling before funding. Don't just accept this as a cost of doing business. Filter your data on down payment, monthly payment, finance term, call center agent, total customer cost to get to the bottom of what is driving your flat cancels.


STEEP EARLY SLOPE

Dangerous. These cancellations are happening so fast, you are not recovering your CPA, let alone the butt in seat to sell the contract.


LONG TAIL

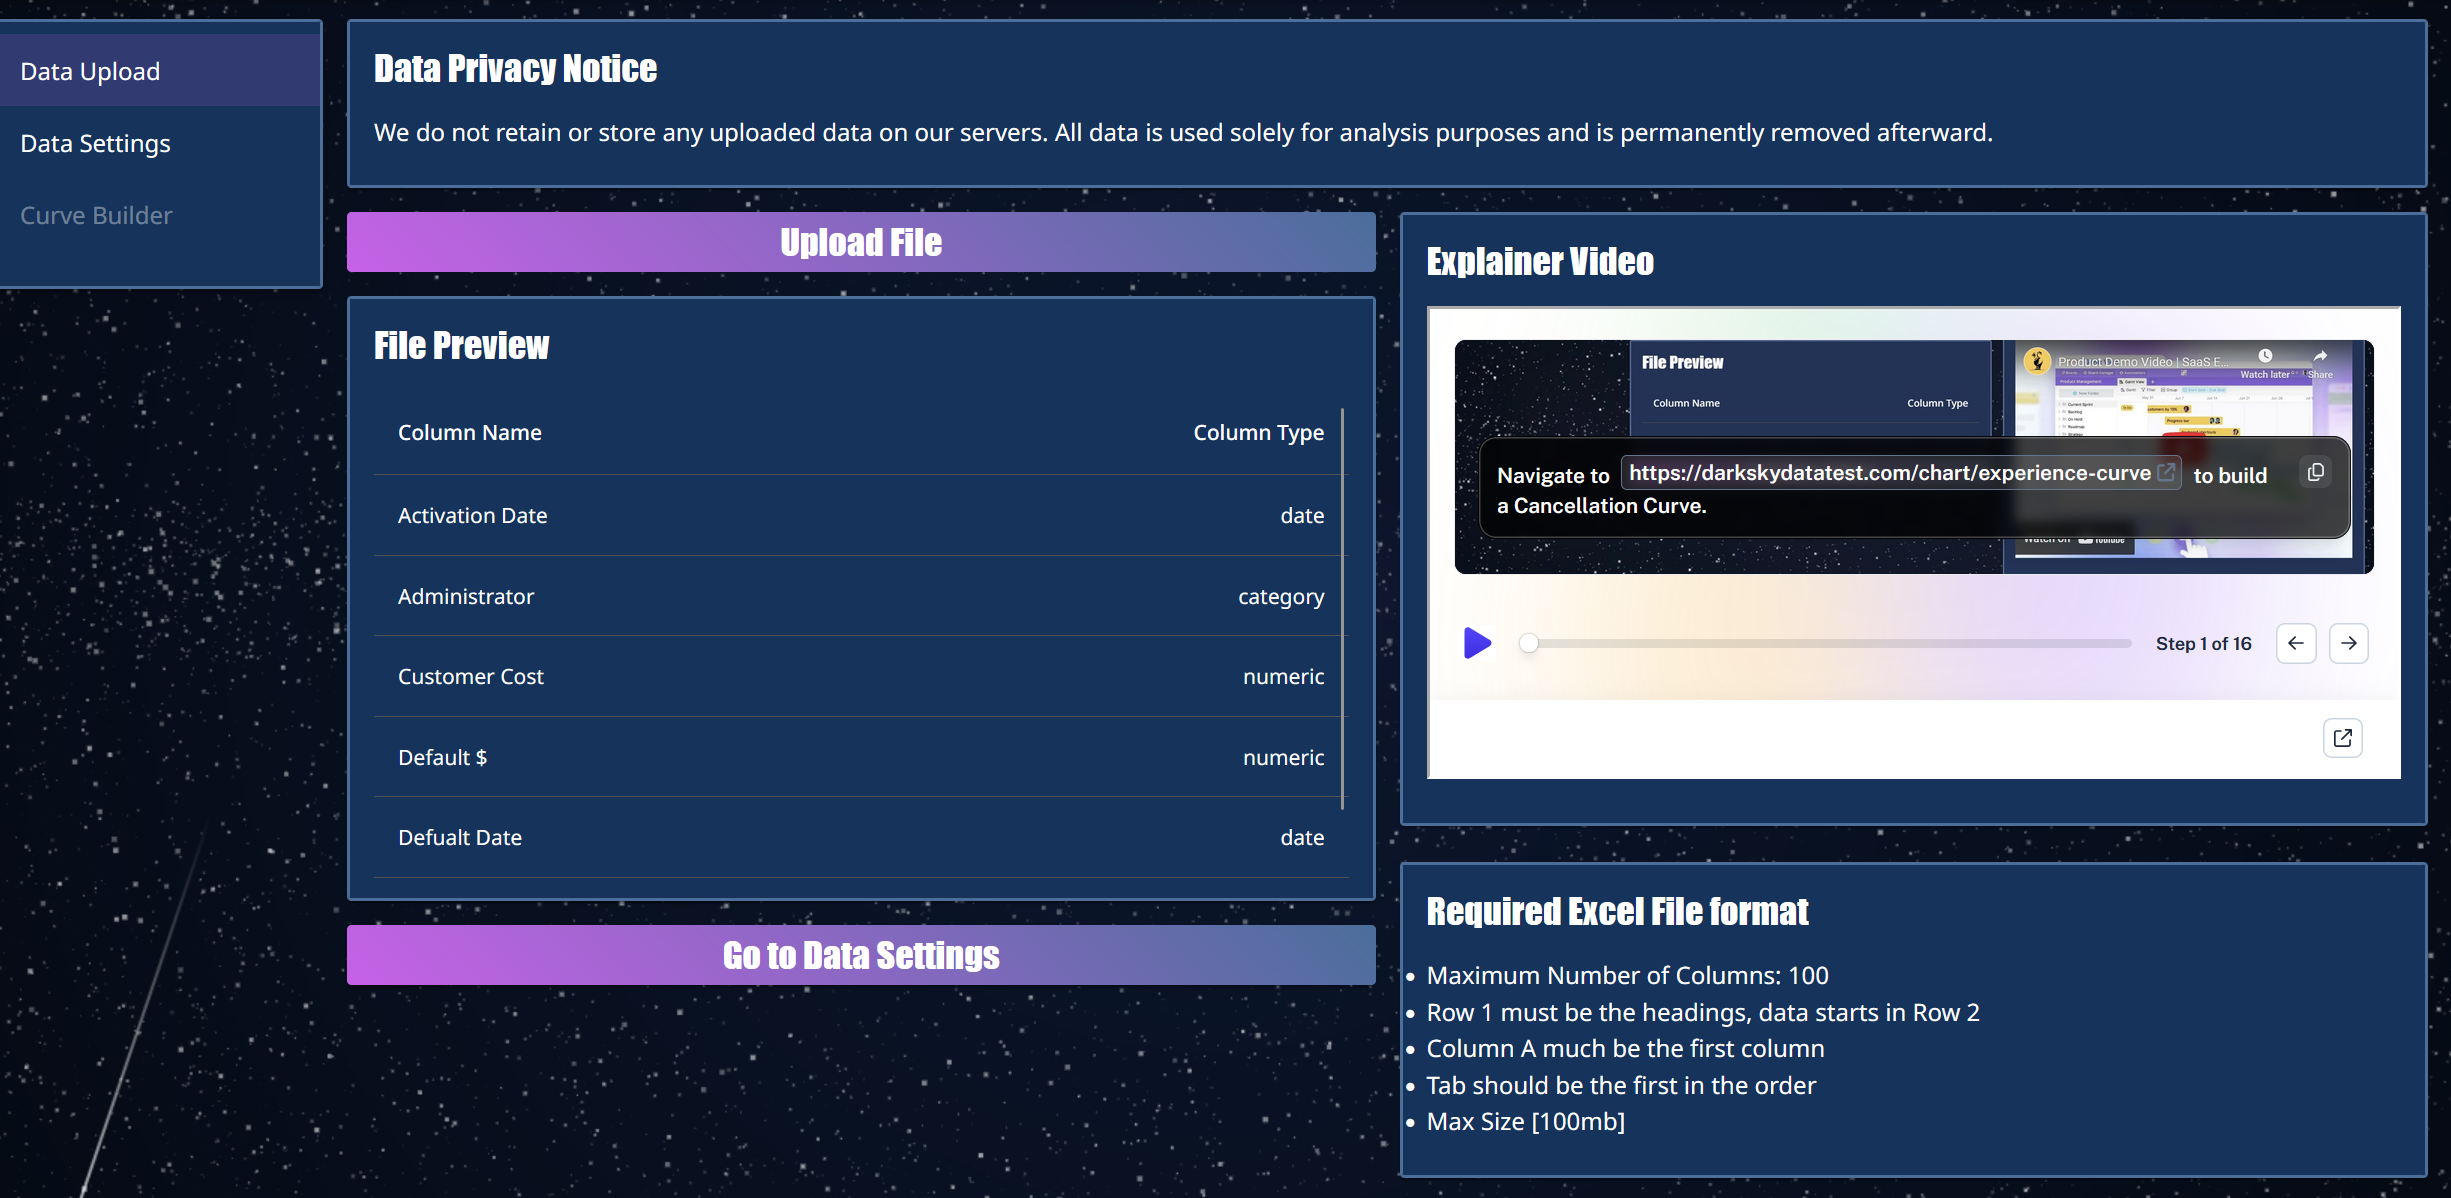
Lower concern. These customers made payments for months. You likely turned a profit before the cancel.

HOW IT WORKS

Step 1: Upload


Drop in your Excel file—no formatting required.

Big files? No problem. Just make sure the data is in the first tab and there is not a blank row above the headings.

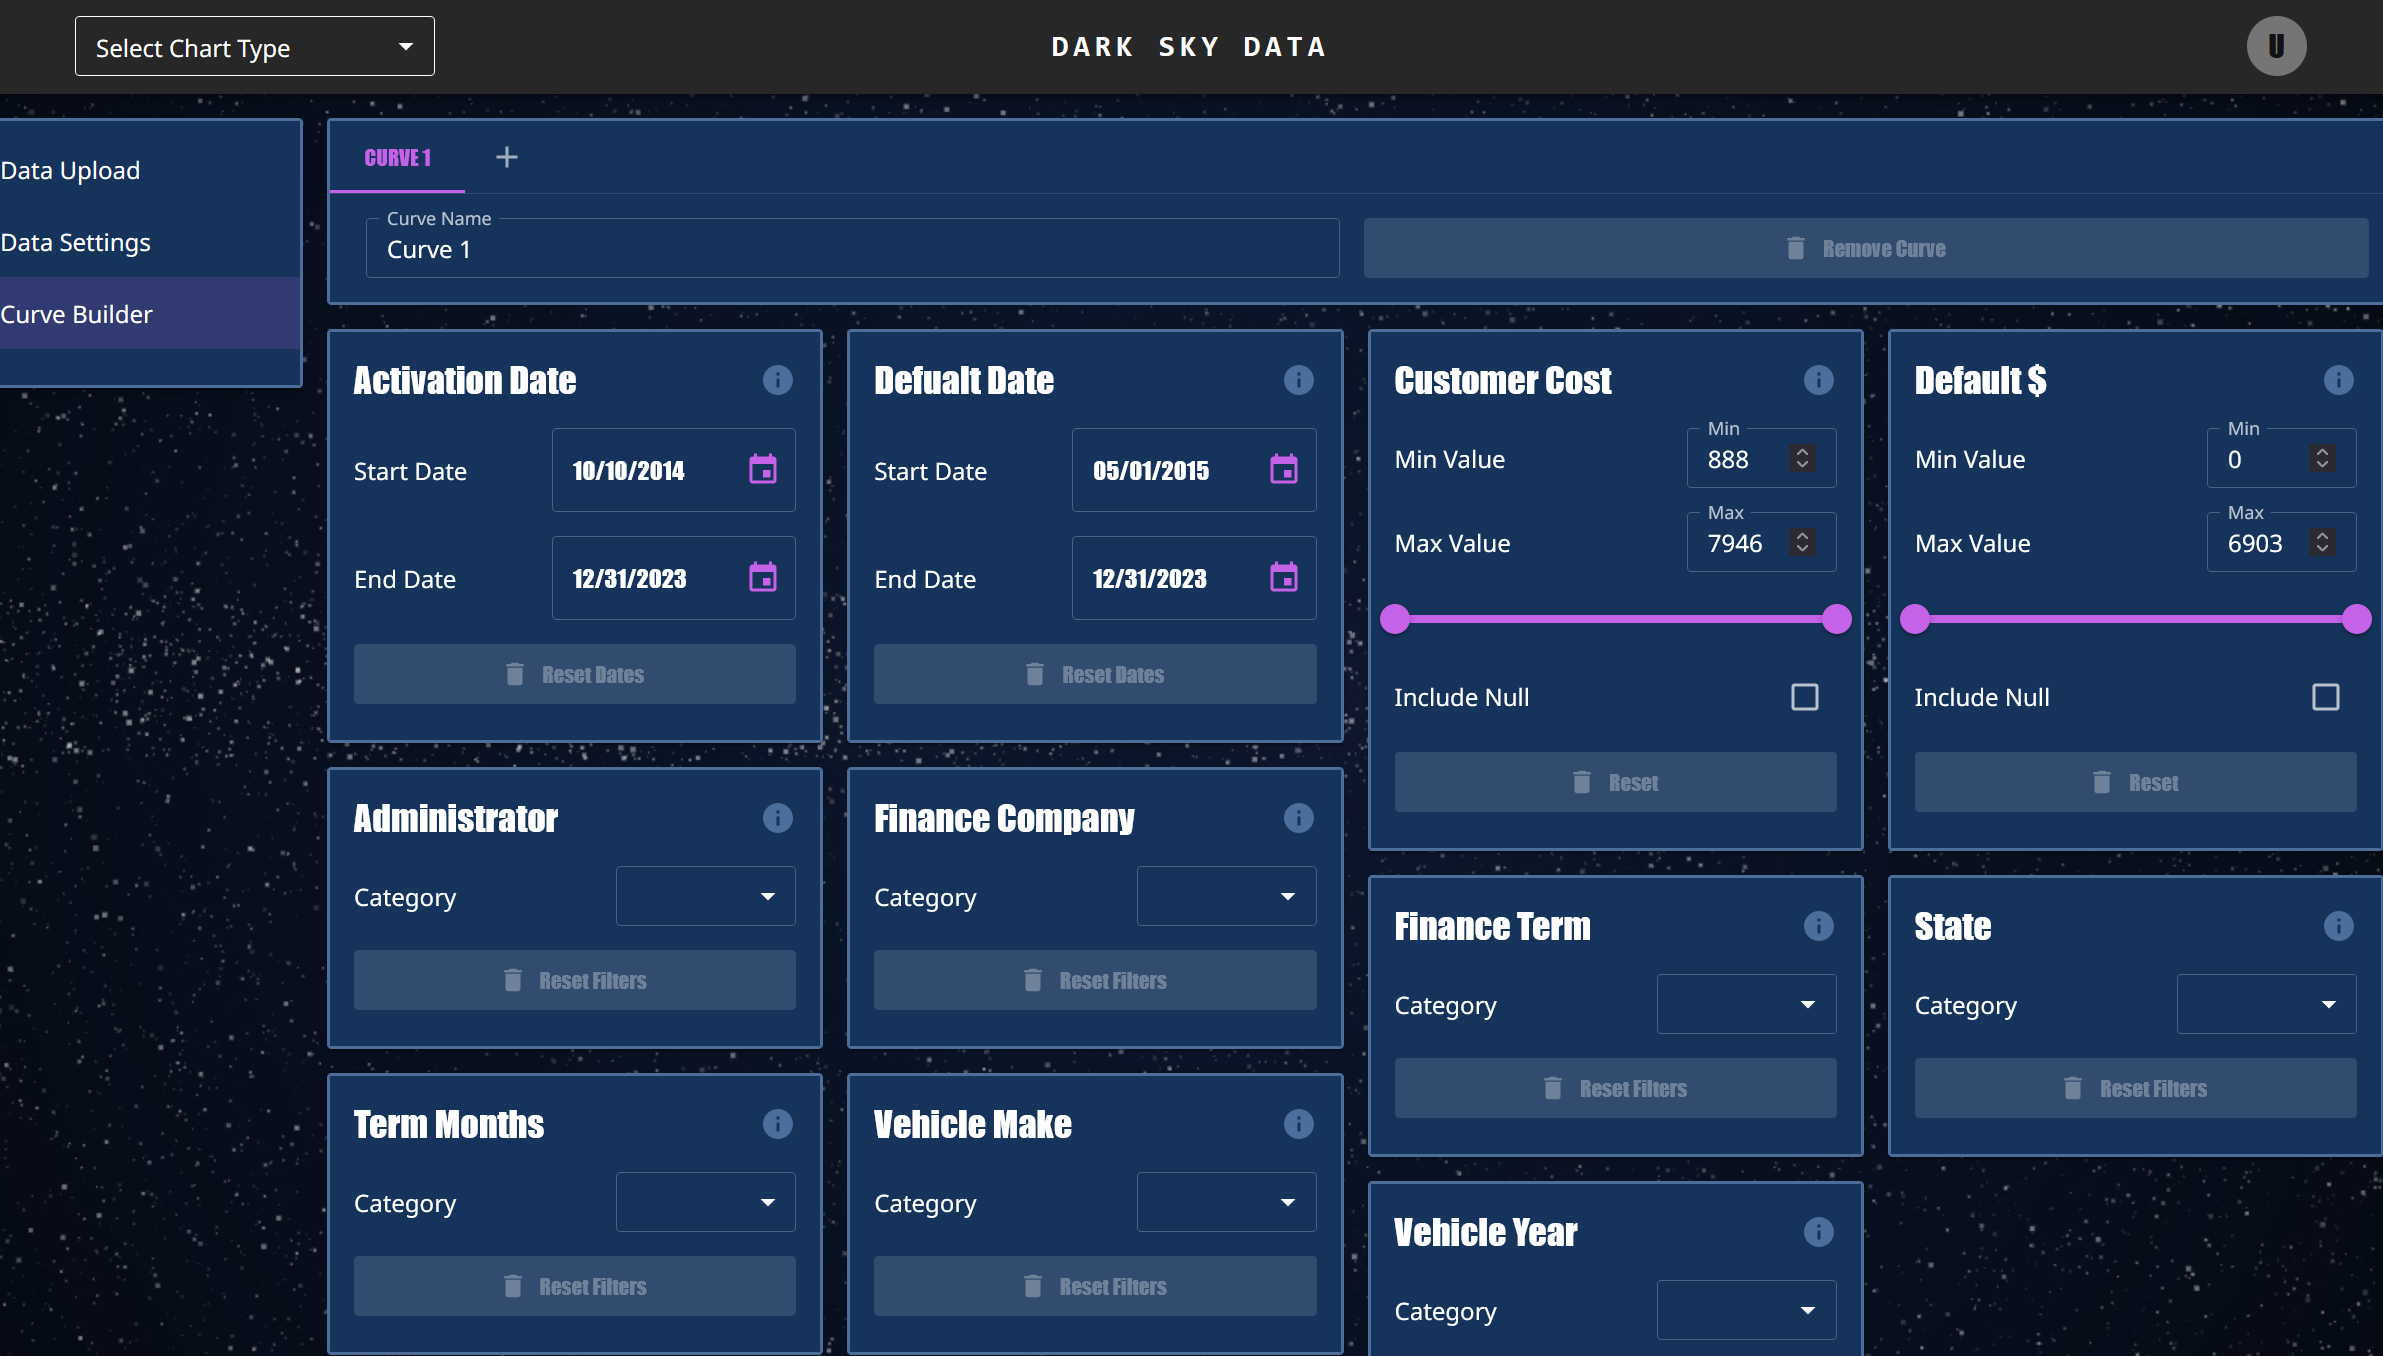
Step 2: SET FIELDS AND FILTERS

Turn any column into a filter: lead provider, finance term, down payment, product, call center agent - you upload it, you can filter.

Step 3: Build Curves

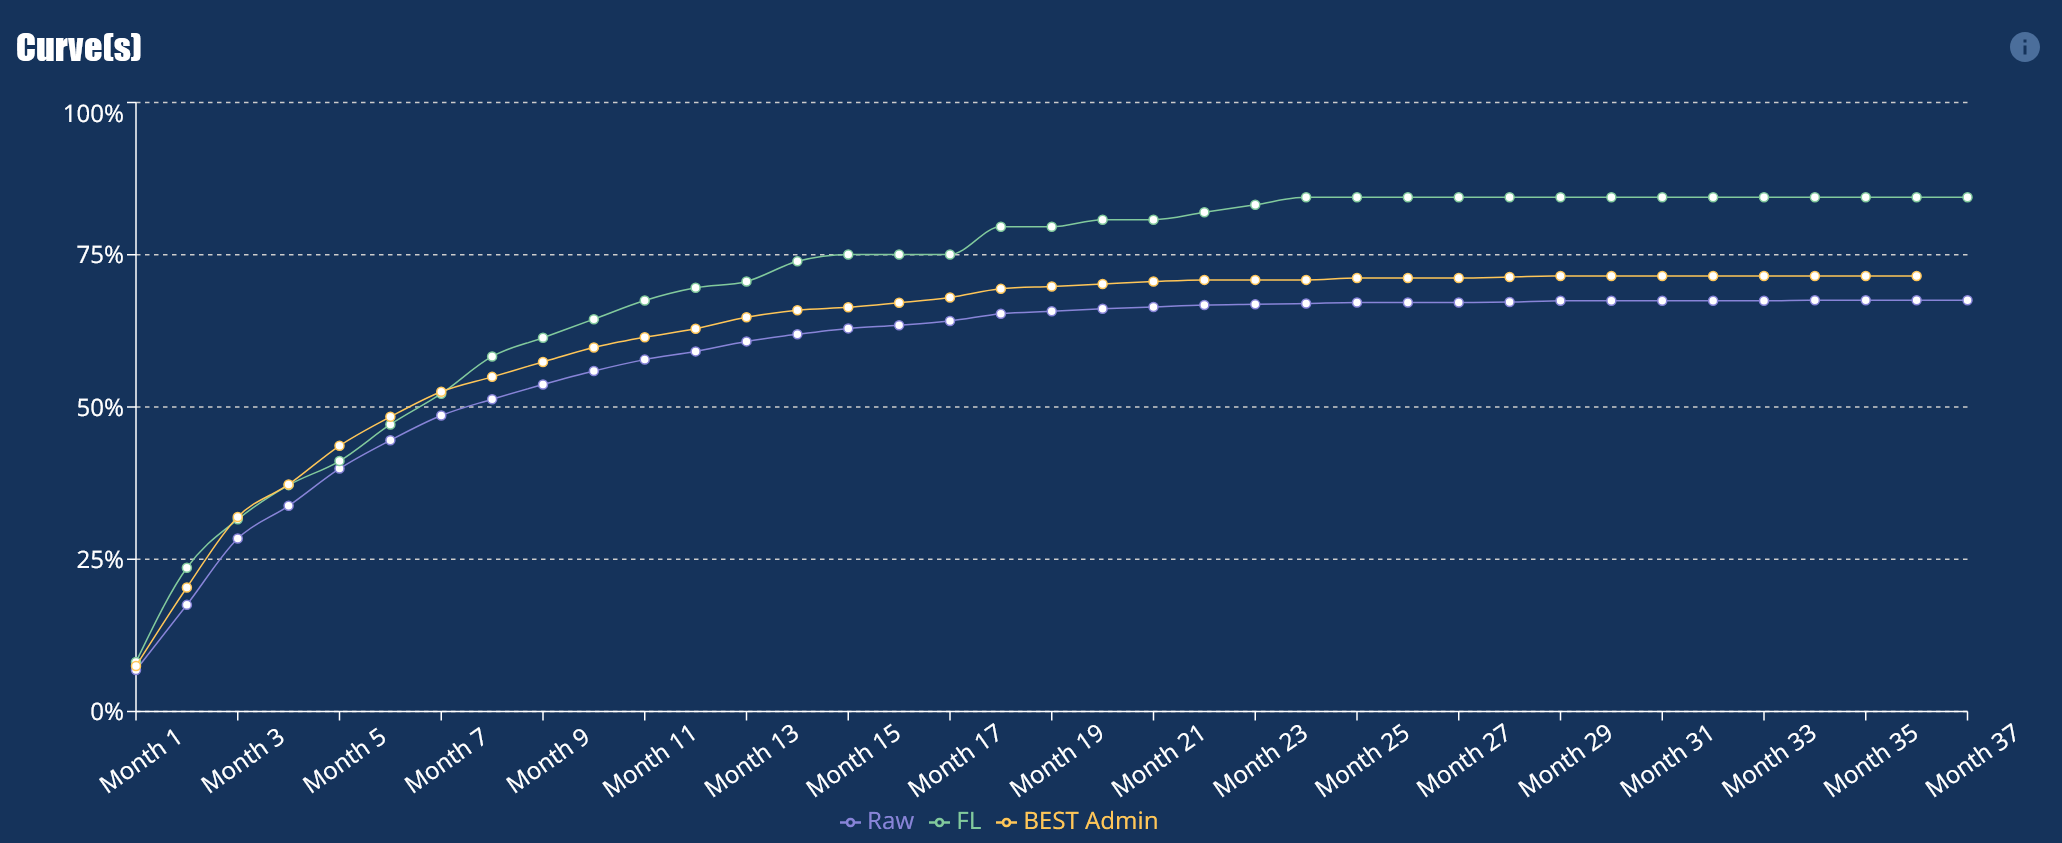
The curve builds itself—automatically and instantly.

Hover to reveal exact values with interactive tooltips.

Compare up to five filtered curves side-by-side, ready to explore or export in Excel.

A VSC Cancellation Curve Provides Real-Time Clarity, No Code Needed

You don’t need a data scientist to make these curves. Just upload your file, set your filters, and get the answers:

  • What’s the cancellation trajectory for each segment?
  • What’s causing spikes in Month 1?
  • Where is performance improving—or declining?

Our no-code tool gives you cancellation visibility that your payment plan company already has.

Ready to flatten your VSC Cancellation Curve—and boost profit?
Upload your data. See where contracts are dropping. Fix it fast—with no-code analytics built for VSC marketers.

Frequently Asked Questions

What is a VSC Cancellation Curve?

A VSC Cancellation Curve shows how Vehicle Service Contracts cancel over time—month by month—after origination. It lets you track when cancellations spike, segment them by lead source, product type, or agent, and identify where you’re leaking margin.

Why do early cancellations matter so much?

Early cancellations—especially within the first 30 days—trigger chargebacks, wipe out customer acquisition costs, and inflate your reserve requirements. Reducing flat cancels drops straight to your bottom line.

How can this help me make more money?

By identifying which campaigns, call center reps, or terms are driving early cancels, you can cut waste and reinvest in what works. A 4-point drop in cancellation rate can mean over $1M in extra annual profit for every 1,000 contracts sold.

Do I need technical skills to use this?

No. Just upload your CSV file and choose your filters—like origination date, lead source, or seller. The curve builds instantly. No code, no formulas, no data scientist required.

Can I compare different lead sources or agents?

Yes. You can filter and compare cancellation behavior by any field in your dataset—lead source, campaign, product type, down payment structure, and more. It’s designed for fast, side-by-side comparisons.

Is this tool just for direct-to-consumer marketers?

No. It’s valuable for anyone managing cancellation risk—including administrators, warranty providers, and even dealers. Different sales channels show different behavior, and this tool helps you see that clearly.