
Cancellation Curves, Claim Frequency Curves
See how behavior unfolds over time—fast. Experience Curves show how key metrics for contracts change as time passes—from cancellations and claims, count and dollar. They turn raw data into visual insights anyone can understand.
In three quick steps, anyone on your team can build and explore curves:
- Upload your Excel file
- Choose your data settings (like date fields and groupings)
- Use Curve Builder to filter columns and reveal trends
Start with cancellations, or go deeper into claims, loan retention, and more. If you can use a spreadsheet, you can use Dark Sky Data.
We never store your data—uploads are processed in-session only and permanently deleted after each use.
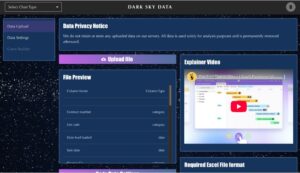 Step 1: Upload
Drop in your Excel file—no formatting required.
Big files? No problem. Just make sure the data is in the first tab.

Step 2: SET FIELDS AND FILTERS
Turn any column into a filter.
Compare cancellations by lender, state, product—even Ford F-150s in Texas vs. Camrys in California.
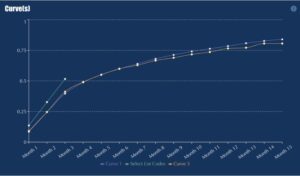 Step 3: Build Curves
The curve builds itself—automatically and instantly.
Hover to reveal exact values with interactive tooltips.
Compare up to five filtered curves side-by-side, ready to explore or export.