Marketing Response Curves
See how prospects respond—by day, week, month, or year.
Marketing Response Curves help you visualize how outreach drives action over time. From first touch to final conversion, these curves turn raw campaign data into clean, time-aligned insights—fast.
 Whether you’re tracking call-ins, form fills, clicks, or closed deals, you’ll see exactly when and how your audience responds. Compare performance across channels, offers, campaigns, or customer segments with just a few clicks.
In three quick steps, anyone on your team can go from spreadsheet to strategic insight:
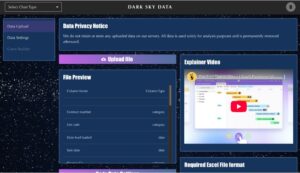
- Upload your Excel file
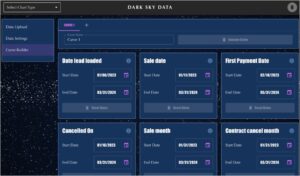
- Choose your time interval (day, week, month, etc.) and grouping fields
- Use Curve Builder to filter and compare results across campaigns
Test response decay. Identify your best-performing lists. Optimize your second touches. All without needing IT, SQL, or a dashboarding tool.
Your data is never stored—uploads are processed in-session and permanently deleted after each use.
Use Cases
Benefits
TIME
Build a Response Curve with filters in under 60 seconds
Skip the 10+ hours it takes to analyze campaign response manually in Excel
ACCURACY
Remove human error with automated cohort tracking
Trust every curve—response logic is consistent, documented, and repeatable
FLEXIBILITY
Filter by channel, offer, segment, or time window
Works with your data—no reformatting or special prep required
How It Works
Step 1: Upl oad
oad
Drop in your Excel file—no formatting required.
Big files? No problem. Just make sure the data is in the first tab.

Step 2: SET FIELDS AND FILTERS
Turn any column into a filter.
Compare marketing responses by campaign, mail house, lead provider or product.
 Step 3: Build Curves
The curve builds itself—automatically and instantly.
Hover to reveal exact values with interactive tooltips.
Compare up to five filtered curves side-by-side, ready to explore or export.
