Warranty Administrators: A cautionary tale—and a fix you can implement today
When it’s time to sell your company, everything gets scrutinized. Especially the numbers.
For F&I administrators, few metrics carry more weight with buyers than the loss ratio—and yet that number is only as accurate as the earnings curve behind it.
If your curve is wrong, your loss ratios are wrong. And if your loss ratios are wrong, your valuation will be too.
Here’s a real-world example of how a standard but flawed accounting approach nearly tanked a deal—and how the right curve saved it.
The Problem: Pro-Rata Earnings with Front-Loaded Claims
A fast-growing F&I administrator was preparing for sale. They offered a range of vehicle service contracts (VSCs), many of which had high early claims frequency. But instead of analyzing how revenue should actually be recognized, they took the default route: a pro-rata earnings curve—spreading revenue evenly over the life of each contract.
It looked like this:
| Contract Length | Claims Activity | Earned Premium Recognition (Pro-Rata) |
|---|---|---|
| 5 Years | 70% in Years 1–2 | 20% per year |
The mismatch was glaring.
Their products were claims-heavy up front, but revenue was being earned evenly. That made early period loss ratios appear inflated—sometimes over 100%.
Buyers saw that and panicked.
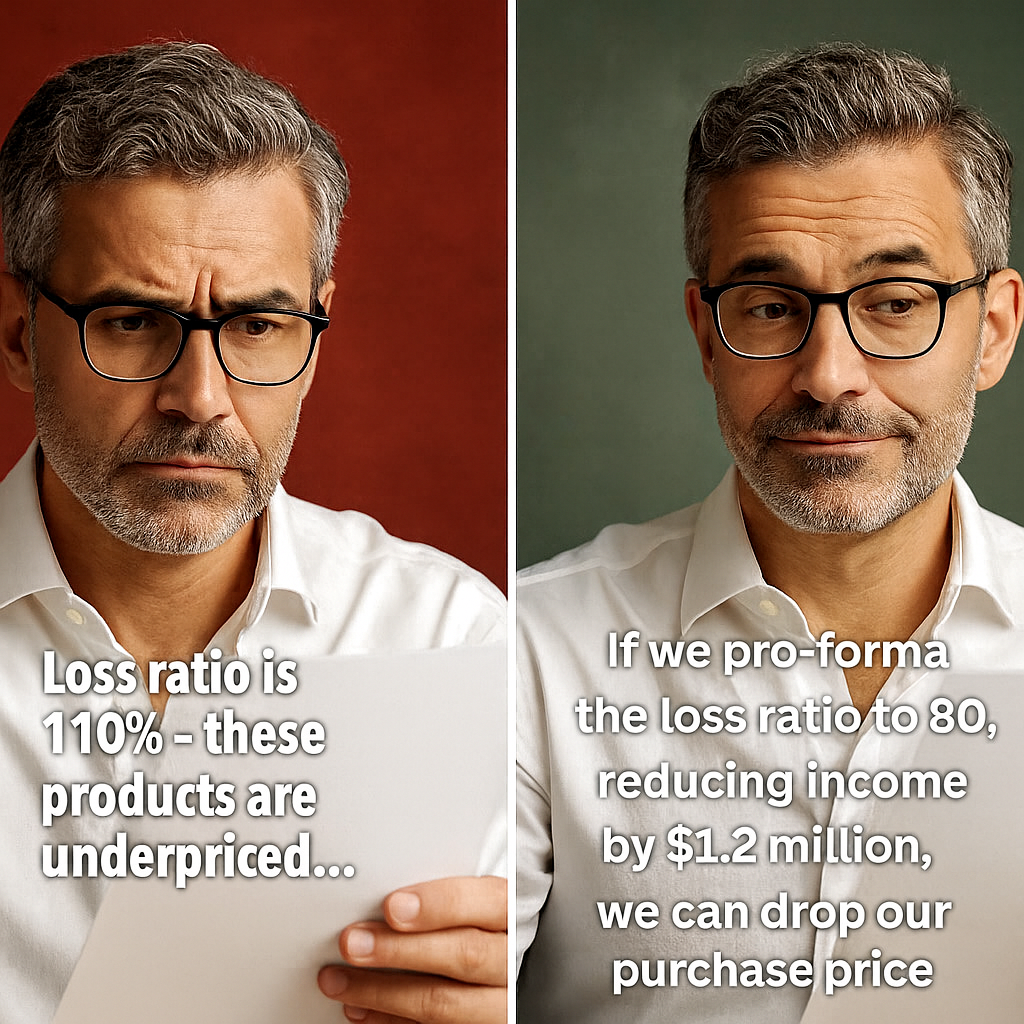
“These products are underpriced. The loss ratio is 110%. That implies the administrator is losing money on every contract.”
Except… that wasn’t true.
The ultimate loss ratio—the one that reflects the full life of the contract—was closer to 80%. Still high, but profitable. And much more reasonable for the segment.
The earnings curve was the problem.
The Impact: A Red Flag That Shouldn’t Have Been
Buyers didn’t want to hear excuses—they wanted answers. And a lower purchase price.
One buyer said:
“If we adjust the loss ratio to 80%, it drops net income by $1.2 million. That means we’re lowering our bid.”
Here’s the catch: Even when an administrator knows their loss ratios are off, they often can’t fix the perception problem in diligence.
Why?
Because buyers lean on third-party experts—usually the CLIP provider. And when data is incomplete or messy, the default approach is always the same: pro-rata. It’s conservative. It’s easy. It’s wrong.
The Fix: An Experience-Based Curve That Tells the Real Story
This administrator was represented by Colonnade Advisors, an investment bank that specializes in the F&I space. Colonnade helped them rebuild their earnings curve based on real experience data.
That curve aligned revenue recognition with actual claims behavior.
The results were dramatic:
- Loss ratio dropped from 110% to 81%
- The buyer re-evaluated their pricing model
- The narrative shifted from “trouble” to “misunderstood profitability”
But it wasn’t easy. It took 30+ hours of manual analysis by the administrator to reconstruct the experience curve. And even then, the buyers still asked:
“Why didn’t you do this earlier?”
Why It Matters
Using the wrong earnings curve doesn’t just create accounting noise—it creates real business risk:
- False red flags about product performance
- Lower valuations in diligence
- Unnecessary delays with auditors and acquirers
- Lost trust with buyers who think you’re hiding something
Fixing it late in the process is possible—but painful. Fixing it before you go to market is better.
The Tool: Dark Sky Data’s Claim Frequency Curve
That’s why we built the Frequency Curve.
This tool makes earnings curve optimization simple—even for non-technical teams.
With just a few clicks, you can:
- Upload historical claims and contract data
- Filter by product type, vintage, region, dealership, or agent
- Instantly generate curves that reflect actual claim emergence
You can use it to get:
- Accurate loss ratios tied to reality
- Defensible earnings timing auditors will trust
- A clearer picture of underwriting performance
- Stronger positioning for M&A
Need to compare how Ford F-150s perform in Colorado vs. Florida? Or how Dealership A compares to Dealership B?
It takes minutes. Just upload, filter, and view.
No data scientist required. No IT ticket. No model-building.
Don’t Let Your Numbers Work Against You
This administrator almost lost millions—not because their products were unprofitable, but because the accounting didn’t reflect reality.
The fix wasn’t a pitch. It was data.
With the Experience Curve from Dark Sky Data, you can get ahead of the issue—long before you’re in diligence.
Don’t let a standard accounting default cost you the deal.
Let’s get your loss ratios—and your earnings curve—working for you.
Use it today: https://darkskydata.com/claim-frequency-curves/

