
See how employee turnover develops over time
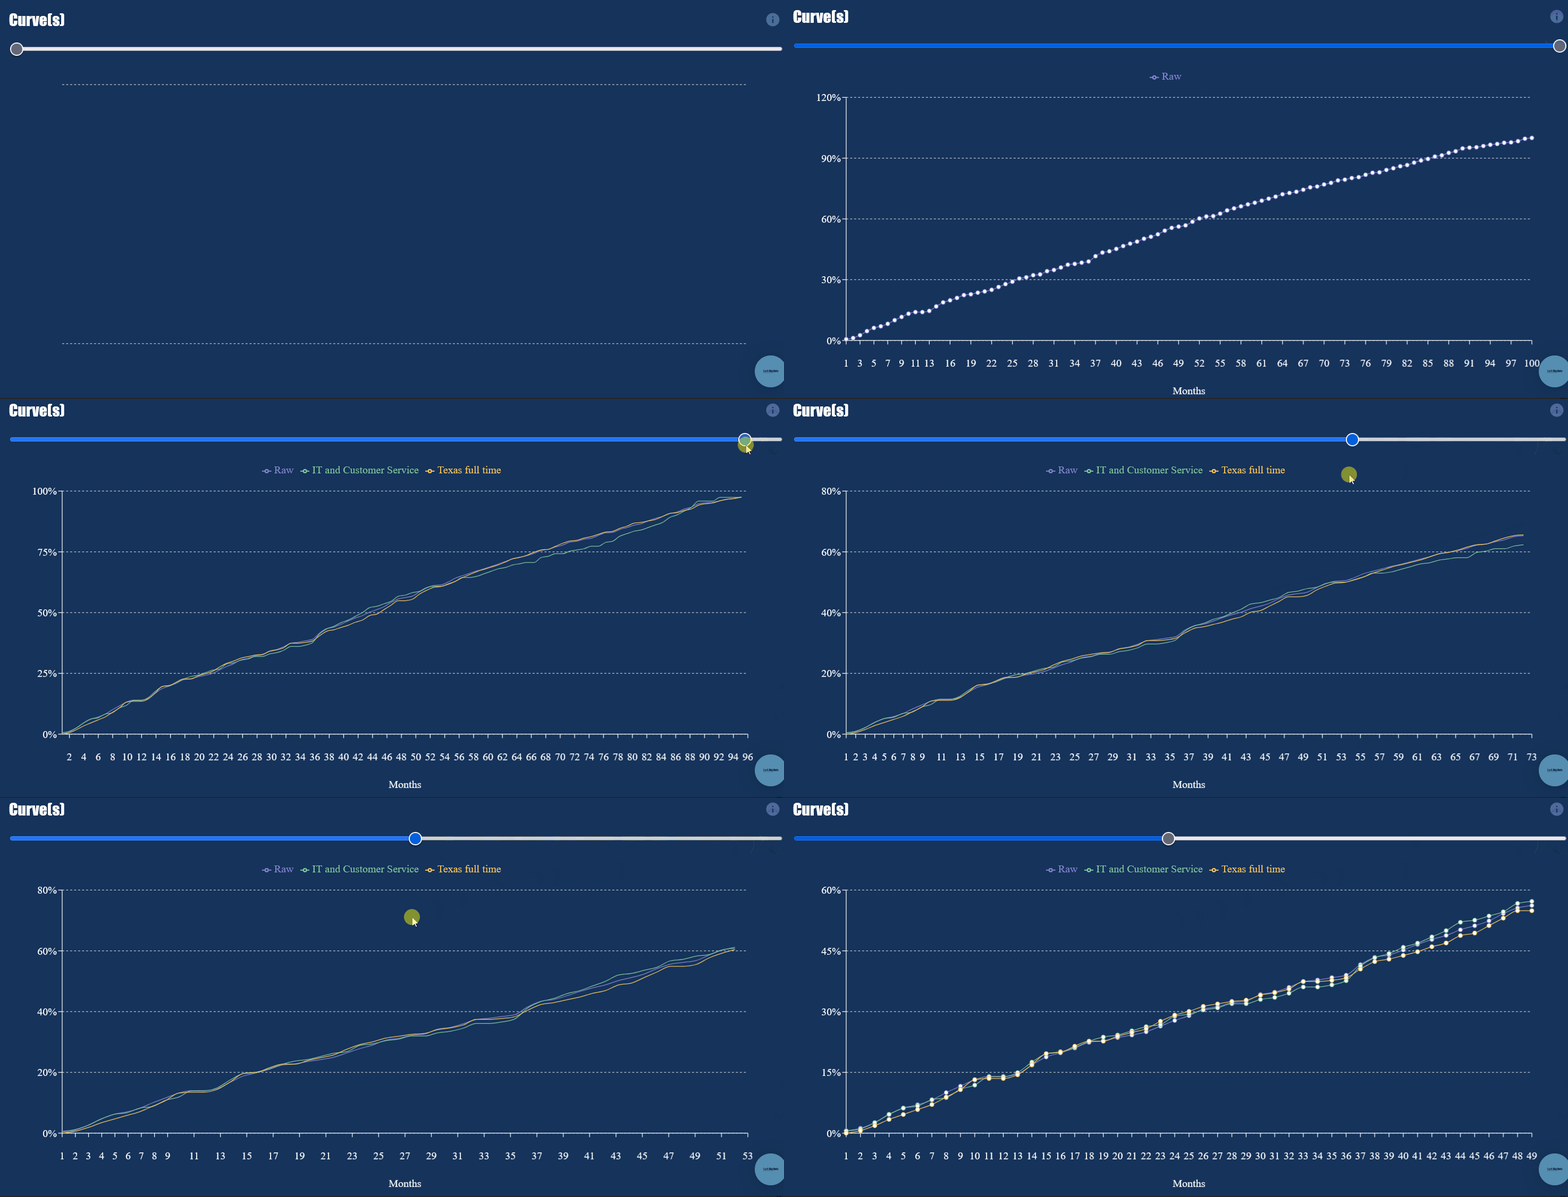
People Curves turn employee start and termination dates into tenure-aligned views that reveal when employees leave and how turnover patterns develop over time. Compare results across departments, roles, locations, hiring cohorts, or other meaningful segments in your workforce data.
Use People Curves to:
- Compare employee turnover across departments, roles, and locations
- Identify when employee departures are most concentrated
- See how turnover patterns differ between hiring cohorts
- Explore the underlying data behind each curve
- Build repeatable workforce comparisons without recreating the analysis manually in Excel
Upload your Excel file, select your employee and date fields, and build curves from the workforce data you already have.
No code. No formulas. Just a clearer view of employee turnover over time.
We never store your data—uploads are processed in-session only and permanently deleted after each use.
Step 1: Upload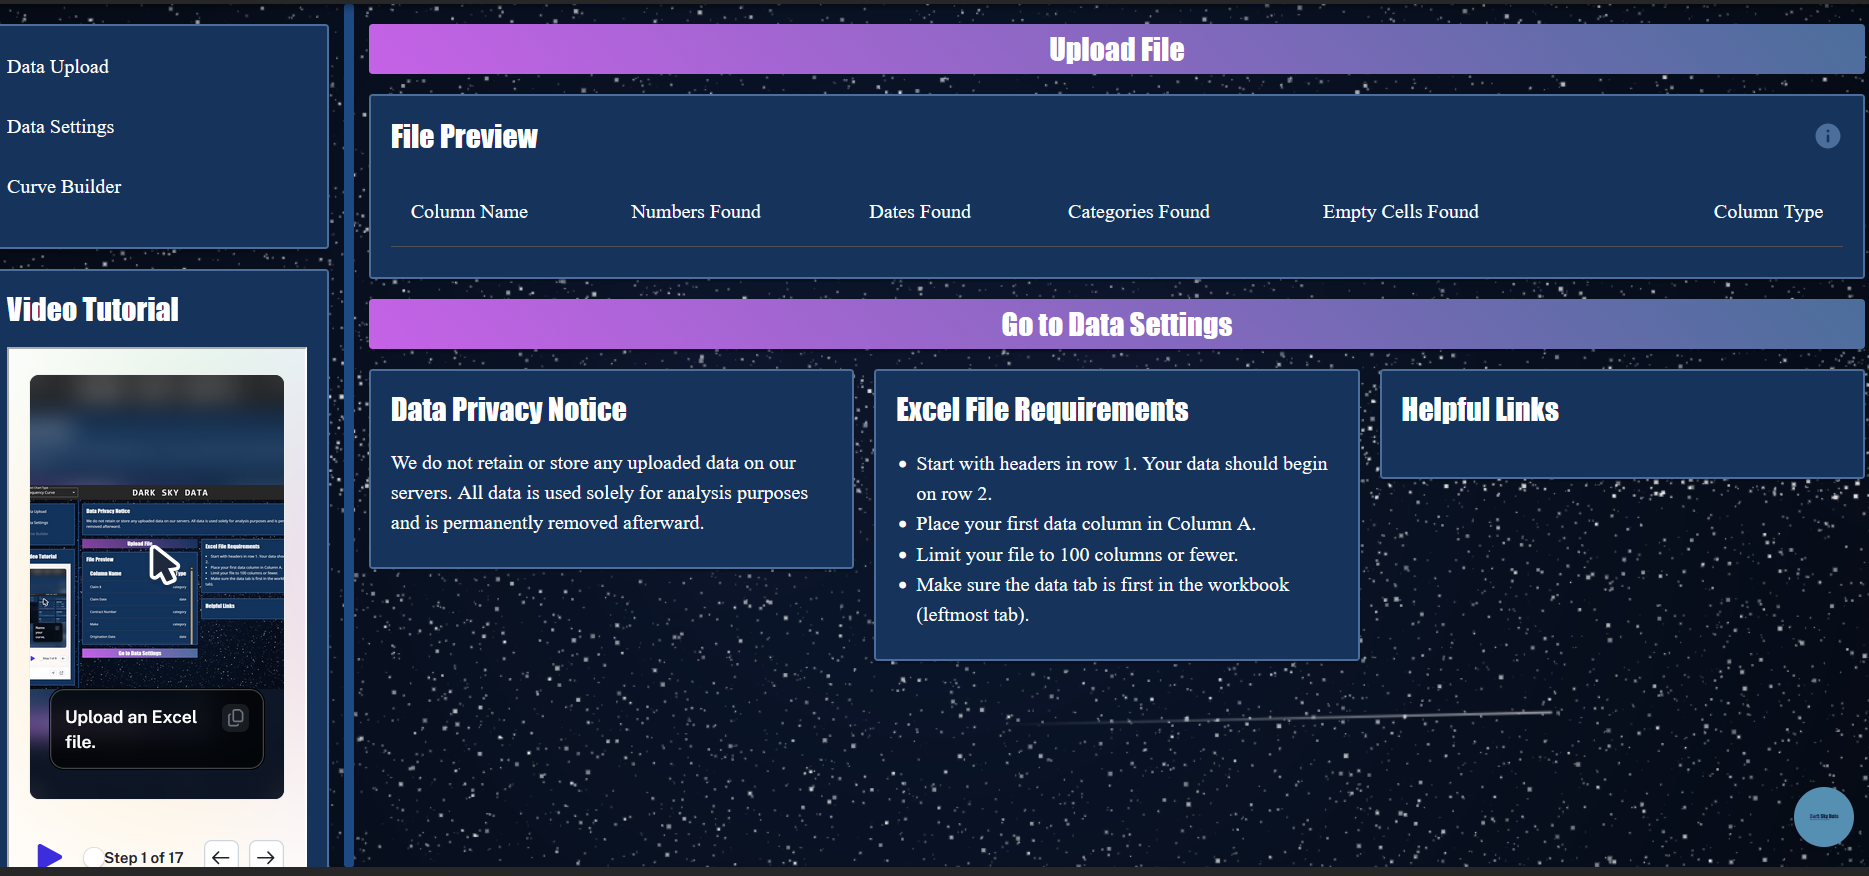
Upload your Excel file containing the employee records you want to analyze.
Once your data is loaded, you can select the fields needed to build your People Curves.
Not sure what to upload? Use our example data.
Step 2: SET FIELDS AND FILTERS
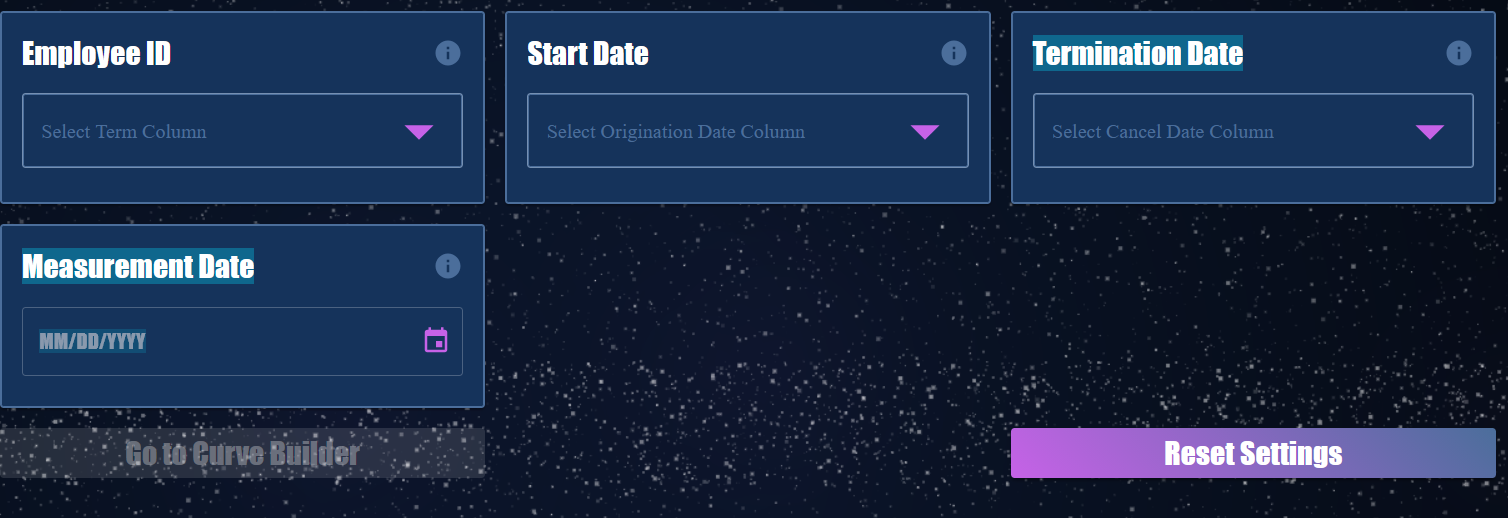
Select your employee ID, start date, termination date, and measurement date to configure your analysis.
Filter and compare turnover across departments, roles, locations, or other meaningful segments in your workforce data.
 Step 3: Build Curves
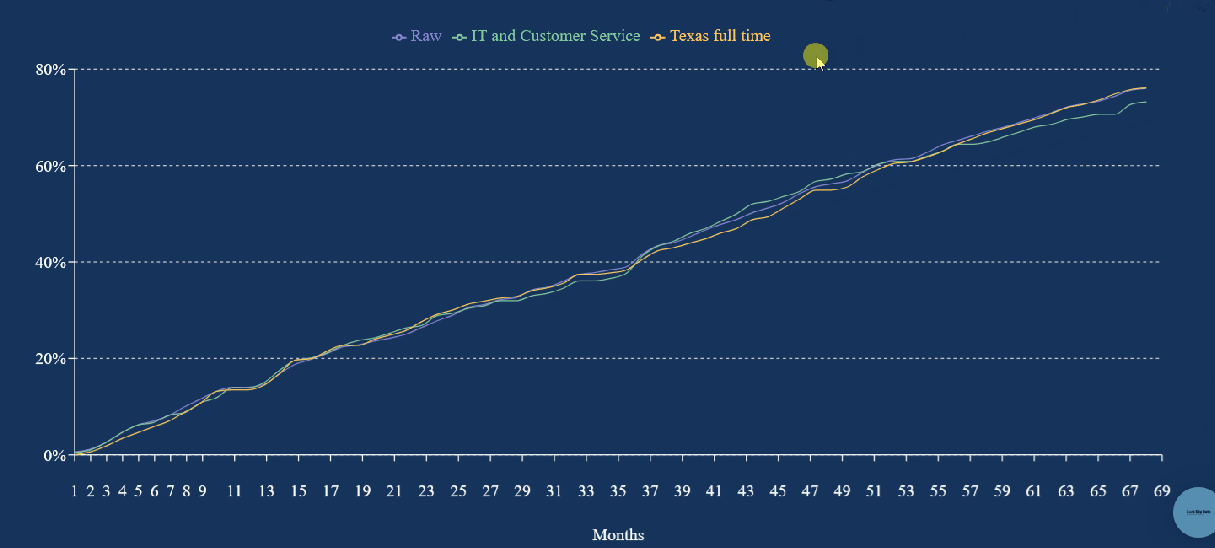
Generate People Curves to see how employee turnover develops over time, measured from each employee's start date.
Compare curves side by side to identify differences in retention and turnover patterns across teams, locations, and hiring cohorts.