
August 2026 New Home Sales: Recovery Gains Traction
Reflecting the most recent U.S. Census Bureau and HUD release (August 2026) | Published September 2026
August 2026 new home sales came in at a seasonally adjusted annual rate of 684,000 — the strongest reading since November 2025 and a 6.4% gain from a revised July. The year-over-year gap narrowed to 2.0% below August 2025’s 698,000, a meaningful improvement from the 5–6% deficits that characterized the first half of the year. The market that spent the spring discounting to find its floor appears, at least through August, to be building off of it.
The inventory picture reinforced that read. Months’ supply fell to 8.5 — matching August 2025 for the first time in this cycle and well below the 9.0-plus readings that persisted through June. That normalization, combined with a median price that held steady just below $400,000, suggests sustained builder discounting is supporting absorption without triggering a sharper price decline.
The year-to-date deficit narrowed to 2.9% through August — down from 5.2% through June. At that pace, 2026 is within reach of finishing near 2025’s full-year total. A lot depends on whether August’s momentum holds into the fall.
For prior context, see our analysis of June 2026 Home Sales and our Home Sales archive.
Key Takeaways
- August 2026 new home sales reached a 684,000 SAAR — up 6.4% from a revised July and the best reading since late 2025.
- Months’ supply returned to 8.5, matching the August 2025 level for the first time this cycle and signaling that inventory is normalizing.
- The year-to-date deficit narrowed to -2.9% through August, down from -5.2% through June, as the market’s pricing strategy continued to support absorption.
</aside>
August 2026 New Home Sales at a Glance
| Metric | August 2026 (p) | July 2026 (r) | August 2025 |
|---|---|---|---|
| SAAR | 684,000 | 643,000 | 698,000 |
| Homes Sold (NSA) | 57,000 | 53,000 | 57,000 |
| Homes For Sale (SA) | 483,000 | 483,000 | 493,000 |
| Months’ Supply | 8.5 | 9.0 | 8.5 |
| Median Sales Price | $393,700 | $392,200 | $417,900 |
On an unadjusted basis, 57,000 homes closed in August — exactly matching the year-ago figure. That is the first month in 2026 where NSA closings have equaled year-ago levels outright, and it underscores the degree to which the summer selling season delivered relative to expectations set by the soft first half.
Revisions Continue to Strengthen the 2026 Arc
This release revised June 2026 significantly upward — from 628,000 SAAR (preliminary) to 672,000, a 7.0% adjustment that makes June the second-strongest month of 2026 behind August. May was revised upward again as well, from 618,000 to 636,000. April moved slightly lower, from 646,000 to 641,000.
| Month | SAAR | Notes |
|---|---|---|
| January 2026 | 576,000 | Revised |
| February 2026 | 630,000 | Revised |
| March 2026 | 659,000 | Revised |
| April 2026 | 641,000 | Revised down from 646,000 |
| May 2026 | 636,000 | Revised up from 618,000 |
| June 2026 | 672,000 | Revised up from 628,000 |
| July 2026 | 643,000 | Revised |
| August 2026 | 684,000 | Preliminary |
The pattern of consistent upward revisions to prior months has become a feature of this year’s data. The 2026 arc, read with current figures, looks considerably more resilient than the spring releases suggested — a steady recovery from January’s 576,000 low, with the summer months delivering sequentially stronger readings when revised.
On an unadjusted basis, the year-to-date total through August 2026 stands at 450,000, down just 2.9% from 463,000 over the same period in 2025. As recently as June’s release, that deficit stood at 5.2%. The compression of that gap over two months is the clearest evidence yet that the market’s pricing strategy has translated into volume recovery.
Regional Picture: South and Midwest Lead, West Persists
The South accounted for 39,000 NSA closings in August — up from 36,000 in August 2025 and the strongest regional performance of the year. On a seasonally adjusted basis, the South reached 451,000 SAAR, up 6.9% from July and 3.4% above year-ago levels. It remains the region carrying the national number.
The Midwest recorded a sharp sequential jump on a seasonally adjusted basis (+84.9% MoM SAAR), though the confidence interval on that figure is wide enough to treat it as directionally positive rather than a precise measure. On an unadjusted basis, the Midwest delivered 7,000 closings — its highest monthly NSA total of 2026 — and is running essentially flat with 2025 YTD pace at -0.6%.
The Northeast dropped sharply month-over-month in seasonally adjusted terms, though with similarly wide confidence intervals. At 2,000 NSA closings, it matched year-ago levels and remains flat YTD.
The West fell to 9,000 NSA closings — the same reading recorded in June and well below the 13,000 posted in August 2025. On a seasonally adjusted basis, the West is 26.8% below year-ago levels, the steepest regional year-over-year deficit in the data. The YTD gap of -10.0% means the West is the single largest drag on national totals. That pattern has held since early 2026 and shows no sign of reversing.
Inventory: Supply Finally Normalizing
Months’ supply fell to 8.5 in August, matching the August 2025 reading after remaining above year-ago levels earlier in 2026. Seasonally adjusted homes for sale held at 483,000, flat from July and 2.0% below August 2025’s 493,000.
The compression in months’ supply from 9.4 (June release) to 8.5 in August reflects a genuine improvement in the pace at which the market is absorbing inventory. It does not yet signal a shortage — 8.5 months remains above the 6.0-month equilibrium — but the directional shift is meaningful after months of elevated readings.
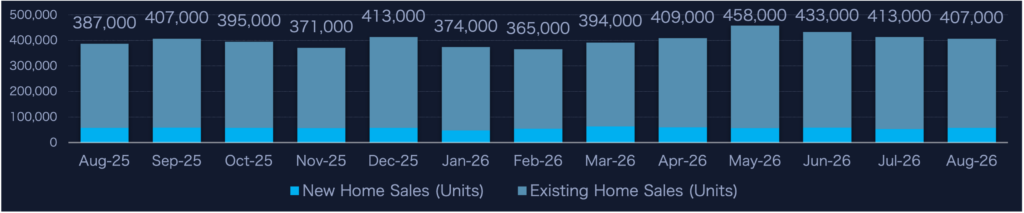
Stage of Construction: Absorption Time Improving
August’s sales mix shifted earlier in the construction cycle. Completed homes accounted for 28,000 of the month’s 57,000 NSA closings, down from 34,000 a year ago, while under-construction sales rose to 22,000 from 18,000. That suggests more August buyers committed before completion rather than relying as heavily on finished inventory.
The median time completed homes spent on the market held at 3.2 months, unchanged from July and down from 3.5 months in May, though still above the 2.4 months recorded in August 2025.
Pricing: Holding the Floor Below $400,000
The median sales price of new homes sold in August 2026 was $393,700 — essentially flat with July’s revised $392,200 (+0.4%) and 5.8% below August 2025’s $417,900. The average sales price was $478,700, down 9.1% from July and 8.8% below year-ago levels.
The stability of the median around $393,000–$394,000 over two consecutive months is a notable development. Through the first half of 2026, the median fluctuated as builders toggled between price holds and concessions. The July–August pattern suggests the low-$390,000 range may be emerging as a clearing price for the current market.
The sub-$400,000 segment represented 52% of August transactions — consistent with recent months. The $300,000–$399,999 bracket remained the single largest tier at 30%, while the under-$300,000 bucket held at 22%.
| Price Range | Units Sold | Share of Total |
|---|---|---|
| Under $300,000 | 13,000 | 22% |
| $300,000 – $399,999 | 17,000 | 30% |
| $400,000 – $499,999 | 12,000 | 22% |
| $500,000 – $599,999 | 5,000 | 9% |
| $600,000 – $799,999 | 6,000 | 10% |
| $800,000 – $999,999 | 2,000 | 3% |
| $1,000,000 and over | 2,000 | 4% |
Higher-price-tier volume remained compressed. The $1M+ category fell to 2,000 units, the lowest reading in the 2026 dataset. The volume concentration at sub-$400,000 price points is not a temporary shift — it has been the consistent market structure since Q1.
Market Implications Heading Into Fall 2026
August’s data makes the clearest case yet that the new home market’s H1 discounting strategy worked. Volume recovered to the best level in nine months. Inventory normalized to year-ago supply levels. The YTD deficit nearly halved in two months. And completed homes are absorbing faster than they were in the spring. The strategy of holding price below $400,000 and accepting modest year-over-year declines appears to have found a demand level that clears.
The questions heading into fall are different from those that dominated the spring. The immediate risk of continued deterioration has diminished — the H2 data increasingly argue against the downward trajectory seen earlier in the year. The issue now is whether the recovery has depth. August’s 684,000 SAAR is a strong number, but it comes with the standard caveat that single-month preliminary figures carry wide confidence intervals and will be revised. The West remains a structural drag, still down 26.8% year-over-year, and any further deterioration there could offset continued strength in the South and Midwest.
The most consequential development in this release may be what it does to the full-year outlook. With 450,000 homes sold through August on a seasonally unadjusted basis — against 463,000 through the same period in 2025 — finishing near 2025’s 678,000 annual total is plausible if September through December holds approximately to year-ago pace. That is a different story than the data told in June.
WHAT TO DO NOW: CHANNEL PLAYBOOKS (DATA-ALIGNED)
IF YOU MARKET DIRECT-TO-CONSUMER (DTC)
The sub-$400,000 segment represented 52% of August sales and has accounted for roughly half of transactions throughout the summer. The buyer profile remains affordability-focused, often transacting on incentivized inventory and attentive to total cost of ownership at closing. If the decline in months’ supply continues into Q4, buyers could face a less incentive-heavy environment than they did during the spring. Messaging that creates timeline awareness — protection locked in now versus waiting — is well-suited to an environment where supply pressure is easing.
Signs of a floor are emerging. Buyers who act now are still entering a market where builders remain motivated. That window has a shape.
IF YOU WORK WITH REAL ESTATE AGENTS
The South and Midwest are the two regions carrying volume growth in 2026, and both are running at or near year-ago pace. Agents with active new-construction referral pipelines in those markets have inventory to work with and builders motivated to close. The improvement in completed homes’ absorption time — from 3.5 median months in May to 3.2 in August — means negotiating leverage on buyer-side transactions is slightly less than it was, though still meaningfully above the 2.4 months recorded in August 2025. Warranty and protection conversations at closing remain relevant but may need to be framed around long-term value rather than builder-distressed urgency.
The South delivered in August. Work where the volume is, and frame your value for a slightly tighter market.
IF YOU PARTNER WITH BUILDERS
The inventory normalization story is the key strategic signal for builder partnerships heading into fall. Months’ supply at 8.5 — back to year-ago territory — means the pressure to deploy heavy incentive packages is easing. That creates both an opportunity and a risk. The opportunity: position warranty bundling not as a distress tool but as a standard closing feature while builders are still in a volume-over-margin posture. The risk: if builders interpret normalizing supply as a reason to reduce incentives before volume has fully recovered, the transaction economics for embedded protection products tighten. The West continues to offer the clearest case for aggressive builder partnership: sales remain 26.8% below year-ago SAAR, giving warranty providers a clear reason to prioritize builder conversations in Western markets.
Inventory is normalizing. Get into builder incentive frameworks now, before the urgency argument fades.
Data Revision Disclosure
Housing market statistics are subject to revision as additional survey data is collected and seasonal adjustments are updated. The figures reported here for April, May, June, and July 2026 reflect standard revisions by the U.S. Census Bureau and HUD and differ from their initial release values. June 2026 SAAR was revised upward from a preliminary 628,000 to 672,000; May 2026 was revised from 618,000 to 636,000. The June 2026 median sales price was also revised, from $398,300 to $406,400. The August 2026 figures are preliminary and will be subject to further revision in subsequent releases. Unless otherwise noted, this analysis reflects the most current data available at the time of publication.
Data Sources
This analysis draws on August 2026 data from:
- U.S. Census Bureau — New Residential Sales (Release CB26-155, September 24, 2026)
- U.S. Department of Housing and Urban Development
- Federal Reserve Economic Data (FRED)
About Dark Sky Data
Dark Sky Data provides housing, economic, and property intelligence designed to help home warranty providers, administrators, and real estate professionals anticipate demand, segment markets accurately, and allocate resources with confidence.