
Dark Sky Data has launched a customer retention analytics platform built to classify every account in a dataset by lifecycle state and measure whether a customer base is expanding, holding, or quietly deteriorating over time. The platform processes customer-level revenue or unit data directly from Excel or CSV files. It supports monthly and annual analysis, […]
Why Timing Between Day 30 and Day 45 Changes the Economics Flat cancels and unfunded contracts are often treated as the same problem in direct-to-consumer Vehicle Service Contract (VSC) marketing. It is not. It is two distinct outcomes with two different economic implications: The nuance that drives confusion in DTC installment billing is the gap […]
As marketing spend increases, cost per acquisition almost always rises. This is not typically a failure of creative, vendors, or execution. It is a structural outcome driven by audience saturation and expansion beyond your highest-probability customers. The strongest prospects convert first. As additional dollars are deployed into weaker segments, conversion rates decline and CPA increases. […]
Turning Claim Trends into Predictive Financial Confidence As warranty administrators plan for 2026, the stakes have never been higher. Costs are rising, competition is fiercer, and margin pressure is intensifying across product lines. Traditional methods — like static averages or lagging year-over-year summaries — leave too much uncertainty around when claims will occur and how […]
Loss ratios sit at the center of every smart underwriting, pricing, and reinsurance decision. Yet most warranty administrators still calculate them with outdated tools, stale data, or earnings curves that haven’t been questioned in a decade. That combination is dangerous—because when your earnings curve is wrong, everything downstream is wrong too. And the truth is […]
If you’re a VSC or home warranty marketer, tracking cancellations isn’t optional. But if you’re still relying on a single cancellation rate number, you’re missing the full story—and leaving money on the table. A cancellation rate tells you how many customers cancel. A cancellation curve tells you when they cancel—and that changes everything. What is […]
If you’re relying on cancellation curves from your payment plan provider—like PayLink, Mepco, or Walco—you’re only seeing part of the story. Those blended curves are useful for tracking total portfolio performance. But they won’t tell you why cancellations are happening. Because they don’t show you the differences that matter. The only way to do that? […]
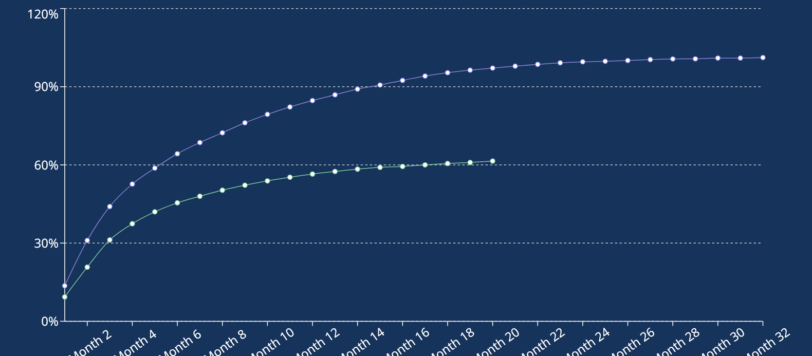
If you’re only looking at your overall cancellation rate, you’re missing the real story. Cancellation behavior isn’t static. It shifts over time—and across different groups of contracts. That’s why you need to break it down by vintage. “A vintage is a group of contracts that started in the same period—typically a month, quarter, or. It’s […]
The Challenge Our client, an investment bank, often constructs cancellation and claims frequency and severity curves for their clients’ financial products. These curves are critical for predicting future cancellations, claim timing, and severity. However, the process is labor-intensive, requiring significant time and manual effort to build each curve from raw data. Updates are even more […]
Our client, a direct-to-consumer marketer of financial products, faced a hidden challenge that was significantly impacting their marketing efficiency and profitability. By purchasing mailing data from multiple vendors, they were unintentionally remailing the same potential customers—resulting in wasted resources and missed opportunities. With a direct mail database of 18 million records, the inefficiencies were costing […]
- 1
- 2