Cancellation Curves: What Slope Tells You That Totals Can’t
In experience curves, the trajectory of cancellations matters more than the final number.
For VSC and home warranty marketers, the timing of cancellations drives profitability. Early cancels destroy cash flow—so don’t just track how many. Track when.
Why do early cancellations hurt more?
If you’re a VSC marketer or home warranty marketer, you know cancellations are part of the game. But when they happen in Month 1 or 2, they’re not just inconvenient—they’re expensive.
Let’s say you spend $500 acquiring a customer. If that contract cancels in the first 30 days:
- You never recover your marketing cost
- You may owe a refund
- You lose processing and servicing time
That’s high churn that directly erodes margin.
Compare that to a cancellation in Month 15. At that point, the customer has likely paid enough to cover acquisition and contribute margin. The damage is far lower.
That’s why your cancellation curve slope matters more than your overall cancel rate.
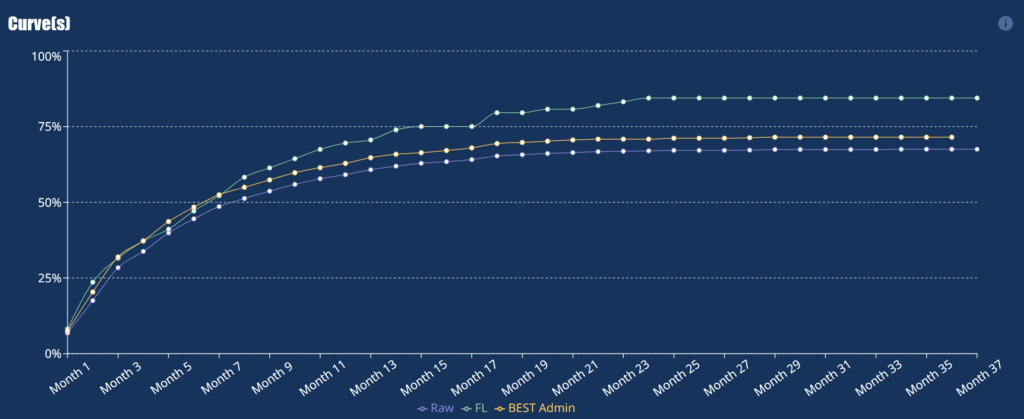
What is an Experience Curve—and what does it show?
An Experience Curve tracks the cumulative cancellation rate over time. It’s a time-aligned view that helps VSC and home warranty marketers answer:
- How fast are contracts canceling?
- Are certain cohorts or segments churning early?
- Which marketing or sales tactics are leading to early drop-off?
A sharp early slope signals front-loaded risk. A flatter slope shows contracts that are sticking—and generating returns.
This view turns hidden churn into visible behavior.
How can I reduce early cancellations?
Now that you can see when churn is happening, you can work backward to reduce it. Here’s how:
Have you looked at cancellations by monthly payment?
Affordability is one of the most consistent churn drivers. If a customer is put into a $180/month plan when they expected $85, they’re more likely to cancel in the first few months.
Use your Experience Curve to segment cancellations by monthly payment and flag:
- Thresholds where churn spikes
- Product/term combinations that push payment too high
- Pricing strategies that overextend buyers
Small adjustments here can dramatically improve downstream retention.
Are some sales reps driving early cancellations?
Certain reps close faster—but close worse.
Segment your Experience Curve by sales rep and identify who’s consistently generating contracts that cancel in Months 1–3. The patterns will jump out:
- Overselling
- Misaligned customer expectations
- Incomplete disclosures
This insight gives you a basis to retrain, reassign, or even realign commissions toward stickier sales.
Are $0-down contracts silently killing your margins?
Down payment is a powerful signal. Contracts with no upfront payment tend to cancel early and often. Customers with more skin in the game stick longer.
When you analyze your Experience Curve by down payment, look for:
- Higher early-month churn on $0-down deals
- More stable retention on $50, $100, or $200 down
- Opportunities to test minimum down payment thresholds
Use this insight to structure smarter offers:
- Enforce a down payment floor
- Offer better pricing for higher initial payments
- Incentivize reps to sell higher-down deals by adjusting commission rates
- Cut lead sources that convert into high-churn $0-down buyers
Why does slope matter for finance and reserve negotiations?
If your payment plan provider is holding back 53% of your cash based on an aggregate cancellation rate, you have an opportunity.
Show them:
- Your recent vintages are performing better
- Your product structure has changed
- Your down payment mix has improved
- Your reps are closing stickier contracts
With that segmentation, you can make the case for lower reserves, faster funding, and better cash flow.
Summary: Why slope beats total cancellations
For VSC marketers and home warranty marketers, here’s the takeaway:
- Early cancellations destroy margin
- The shape of your curve shows the real behavioral risk
- Segmentation by term, rep, payment, and down uncovers the cause
- Slope tells a story you can act on
- Lower risk = stronger leverage with finance companies
Want to see your curve? We built a no-code tool that gives you instant answers.
📊 Experience Curve by Dark Sky Data