If you’re a VSC or home warranty marketer, tracking cancellations isn’t optional. But if you’re still relying on a single cancellation rate number, you’re missing the full story—and leaving money on the table. A cancellation rate tells you how many customers cancel. A cancellation curve tells you when they cancel—and that changes everything. What is […]
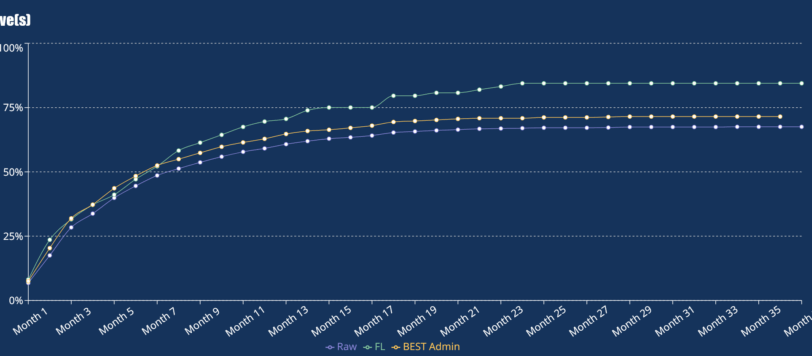
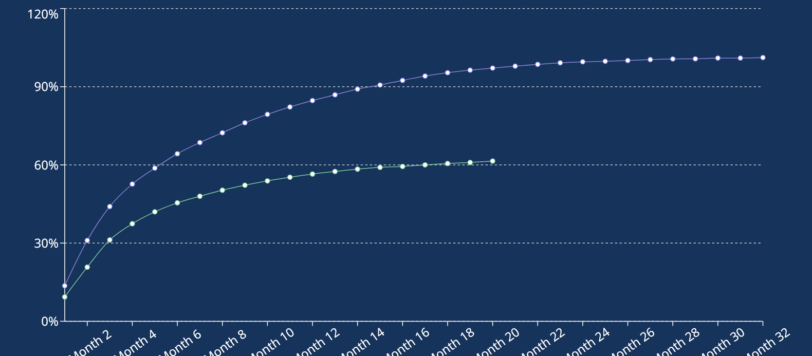
In experience curves, the trajectory of cancellations matters more than the final number. For VSC and home warranty marketers, the timing of cancellations drives profitability. Early cancels destroy cash flow—so don’t just track how many. Track when. Why do early cancellations hurt more? If you’re a VSC marketer or home warranty marketer, you know cancellations […]
If you’re relying on cancellation curves from your payment plan provider—like PayLink, Mepco, or Walco—you’re only seeing part of the story. Those blended curves are useful for tracking total portfolio performance. But they won’t tell you why cancellations are happening. Because they don’t show you the differences that matter. The only way to do that? […]
If you’re only looking at your overall cancellation rate, you’re missing the real story. Cancellation behavior isn’t static. It shifts over time—and across different groups of contracts. That’s why you need to break it down by vintage. “A vintage is a group of contracts that started in the same period—typically a month, quarter, or. It’s […]
When preparing a company for sale, financial optics matter. For F&I administrators, few metrics carry more weight with buyers than loss ratios—and those ratios are only as accurate as the earnings curve behind them. F&I earnings curve optimization must happen before a company goes up for sale. Here’s a real-world example of how defaulting to […]
If you’re administering Vehicle Service Contracts, VSC cancellations aren’t just noise—they’re a direct hit to profitability. Refund exposure. Margin compression. Loss ratio volatility. Whether contracts are sold direct-to-consumer or through dealerships, VSC cancellations are a real and rising cost. And yet, most administrators aren’t actively tracking how, when, and where these VSC cancellations are happening. […]
VSC Cancellations: See What’s Costing You—and Fix It FastHow an Improved VSC Cancellation Curve Drops Profit to the Bottom Line Even a small improvement in your VSC cancellations drops straight to the bottom line. Look at the example. Just a 4-point reduction in cancellations—from 52% to 48%—could mean an extra $100,000 in profit every month […]
If you’re selling Vehicle Service Contracts (VSCs) directly to consumers, you’re operating in a high-cancel environment. Many marketers see 40–80% of contracts cancel, and flat cancels—those within 30 days—are especially painful. They erase margin, trigger chargebacks, and undermine performance metrics. But not all VSC cancellations are created equal. Contracts that cancel later are far more […]
See how behavior unfolds in real time. Our no-code cancellation curve tool reveals how key contract metrics evolve, from count to dollar impact. It turns raw data into visual insights anyone can understand—no code, no formulas, just clarity. Build and explore your own curves in three simple steps: Upload your Excel file Choose your data […]
Track how balances shift over time—by contract, loan, policy, or client account—with the Balance Curve Analytics Tool. This tool transforms raw data into clear, time-aligned visuals that reveal how value moves across a cohort—month by month. Whether you’re tracking balance decline (paydown) or accumulation (build), each record is aligned from Month 1 forward based on […]