
December 2025 Home Sales: Selective Improvement, Structural Constraints Remain
Reflecting the most recent U.S. Census Bureau and NAR releases (December 2025) | Published February 2026
December 2025 home sales did not mark normalization. They demonstrated that turnover can improve without structural convergence between new construction and resale markets.
Buyer demand responded to modest rate relief. Resale activity accelerated meaningfully. Builder inventory compressed into year-end. Yet underlying constraints — particularly in resale supply — remained intact.
Viewed from early 2026, December reads not as a reversal, but as selective improvement within a still-segmented housing structure.
For prior context, see our analysis of November 2025 Home Sales and additional reporting in our Home Sales archive.
December 2025 Home Sales at a Glance: Narrowing the Gap
| Metric | New Homes | Existing Homes |
|---|---|---|
| Monthly Closings (NSA) | 57,000 | ~356,000 (estimated) |
| SAAR Sales Volume | 745,000 | 4.27 million |
| Median Sale Price | $414,400 | $382,600 |
| YoY Price Change | -2.0% | +4.4% |
| Inventory Conditions | Compressing | Improving modestly |
Why it mattered:
Resale turnover reached its strongest pace in nearly three years, while builder inventory tightened into year-end. The imbalance between builder-managed liquidity and resale-constrained supply narrowed — but it did not close.
December 2025 Home Sales: New vs. Existing
The defining feature of December 2025 home sales was acceleration in resale alongside stabilization in new construction.
- New residential sales (not seasonally adjusted) increased from 53,000 in November to 57,000 in December.
- Existing-home sales rose to a 4.27 million seasonally adjusted annual rate (SAAR).
- Builder inventory declined modestly.
- Rate-sensitive demand translated into measurable transaction gains.
The market did not fully converge. It continued operating through two distinct liquidity systems.
New Home Sales: Builders Closed the Year Steadily
On a not seasonally adjusted basis, 57,000 new homes were sold in December, up from 53,000 in November — a 7.5% month-over-month increase.
These are actual monthly transactions, not annualized projections.
New Residential Sales (Not Seasonally Adjusted)
| Metric | November 2025 | December 2025 | MoM Change |
|---|---|---|---|
| Homes Sold | 53,000 | 57,000 | +7.5% |
| Homes For Sale | 486,000 | 470,000 | -3.3% |
| Median Sales Price | $397,600 | $414,400 | +4.2% |
Actual inventory declined as closings outpaced new additions.
Structural Supply Metrics (Seasonally Adjusted)
| Metric | November 2025 | December 2025 |
|---|---|---|
| SAAR | 758,000 | 745,000 |
| Homes For Sale (SA) | 475,000 | 472,000 |
| Months’ Supply | 7.7 | 7.6 |
Seasonally adjusted supply remained elevated relative to resale markets but continued compressing into year-end.
New construction ended 2025 stable, not expanding.
New vs. Existing Home Sales Volume (12-Month View)
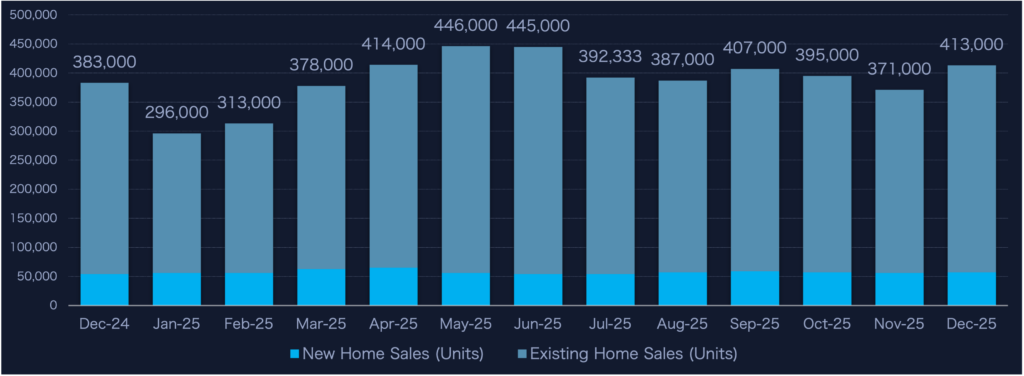
The 12-month view underscores that December did not eliminate segmentation. Resale volume improved sharply, but builder-driven inventory management remained structurally distinct.
While resale homes accounted for the majority of transactions, new construction continued to provide pricing flexibility and inventory responsiveness not present in the existing-home market.
Existing Home Sales: Strongest Pace Since 2022
Existing-home sales rose to a 4.27 million SAAR in December 2025, up from 4.09 million in November and the strongest pace in nearly three years.
Lower mortgage rates late in the quarter supported buyer participation. The acceleration was broad-based across regions.
| Metric | November 2025 | December 2025 |
|---|---|---|
| Existing Home Sales (SAAR) | 4.09M | 4.27M |
| Median Existing Price | $409,200 | $382,600 |
| Year-over-Year Price Change | +1.2% | +4.4% |
Pricing improved month-over-month while remaining rate-sensitive. The rebound in transaction volume reflects demand responsiveness to modest mortgage rate relief, not a structural reopening of resale supply.
Limited inventory continues to provide price support, even as affordability pressures remain elevated relative to historical norms
Regional Breakdown — Existing Home Sales (SAAR)
| Region | December 2025 |
|---|---|
| Northeast | 510,000 |
| Midwest | 990,000 |
| South | 1,990,000 |
| West | 780,000 |
Despite the improvement, turnover remains below pre-pandemic norms. The December increase reflects demand responsiveness to rate relief, not a structural reopening of resale inventory.
Regional Trends: December 2025 Update
| Region | Inventory YoY | Price Trend YoY | Days on Market |
|---|---|---|---|
| West | Moderating | Softening to flat | Higher |
| South | Stabilizing | Flat | Slightly higher |
| Midwest | Limited expansion | Flat to modest gains | Stable |
| Northeast | Tight | Flat to modest gains | Slightly higher |
Compared with November, pricing pressure eased further in Western markets while Midwest and Northeast conditions remained comparatively firm.
Inventory growth slowed into year-end. Days on market remained elevated relative to early 2025 levels.
Inventory Conditions: Stabilizing, Not Expanding
Builder inventory declined modestly in December, while resale supply remained structurally constrained relative to historical norms.
Sellers continued to exhibit pricing discipline. Builders retained greater flexibility to adjust incentives and financing structures.
The supply imbalance moderated, but it did not resolve.
Mortgage Rates & Affordability
Mortgage rates eased into the low-6% range late in 2025. That modest relief translated into measurable gains in resale activity.
However, prevailing rates remain materially above the levels many homeowners hold. Lock-in dynamics continue to limit resale participation.
Affordability improved at the margin, not structurally.
What Changed From November
- Resale turnover accelerated meaningfully.
- Builder inventory compressed modestly.
- Rate relief translated into measurable transaction improvement.
Structural constraints remained intact.
Market Implications Heading Into 2026
December confirmed that housing liquidity can improve without full normalization.
Builders remain the more adaptable supply engine. Resale remains rate-sensitive and inventory-constrained. National aggregates continue to blend structurally different markets.
The imbalance narrowed in December — but it did not resolve.
WHAT TO DO NOW: CHANNEL PLAYBOOKS (DATA-ALIGNED)
IF YOU MARKET DIRECT-TO-CONSUMER (DTC)
- Target builder-driven markets where transaction flow remains active
- Align messaging with affordability and payment stability
- Avoid assuming resale-driven volume acceleration
Demand remains payment-sensitive. Messaging should align with affordability engineering, not speculative appreciation narratives.
IF YOU WORK WITH REAL ESTATE AGENTS
- Prioritize Midwest and Northeast markets where pricing remains comparatively stable
- Position warranties as negotiation and inspection-risk tools
- Support agents with days-on-market and price-discipline messaging
Conversion efficiency matters more than volume assumptions in a segmented market.
IF YOU PARTNER WITH BUILDERS
- Bundle warranties with closing incentives and mortgage buydowns
- Position coverage as part of affordability, not an add-on
- Focus on higher-inventory communities where incentives remain active
Builders continue to function as the most flexible liquidity engine in the current cycle.
Data Revision Disclosure
Housing market statistics are subject to revision. The U.S. Census Bureau and the National Association of REALTORS® periodically update prior-month figures as additional survey responses are received and seasonal adjustments are recalculated.
Unless otherwise noted, this analysis reflects the most current data available at the time of publication.
Data Sources
This analysis draws on December 2025 data from:
- U.S. Census Bureau — New Residential Sales
- U.S. Department of Housing and Urban Development
- National Association of REALTORS® — Existing Home Sales
- Federal Reserve Economic Data (FRED)
- HousingWire
- Redfin
- Realtor.com
- State REALTOR® associations and regional MLS data
About Dark Sky Data
Dark Sky Data provides housing, economic, and property intelligence designed to help home warranty providers, administrators, and real estate professionals anticipate demand, segment markets accurately, and allocate resources with confidence.
National headlines blend markets. We isolate them.