
January 2026 Home Sales: Early-Year Reset, Structural Reality
Reflecting the most recent U.S. Census Bureau and NAR releases (January 2026) | Published March 2026
January 2026 home sales did not extend year-end momentum. They clarified how the housing market is likely to behave in early 2026.
New residential transactions declined on an actual monthly basis. Existing-home turnover declined from December levels but remained within the constrained range observed throughout 2025. Inventory remained elevated in new construction and constrained in resale. Pricing adjusted where necessary.
Viewed from March 2026, January 2026 home sales read as a reset. The housing market did not break down. It returned to its underlying structure.
For prior context, see our analysis of December 2025 Home Sales and additional reporting in our Home Sales archive.
January 2026 Home Sales at a Glance: Reset, Not Reversal
| Metric | New Homes | Existing Homes |
|---|---|---|
| Monthly Closings (NSA) | 48,000 | ~326,000 (estimated) |
| SAAR Sales Volume | 587,000 | 3.91 million |
| Median Sale Price | $400,500 | $396,800 |
| YoY Price Change | -6.8% | +0.9% |
| Inventory Conditions | Elevated | Gradually improving |
Why it mattered:
December suggested momentum. January clarified the limits of that momentum. Builder-driven activity pulled back as affordability constraints reasserted themselves, while resale markets remained stable but structurally restricted. The result was not contraction. It was normalization.
January 2026 Home Sales: New vs. Existing
The defining feature of January 2026 home sales was the re-emergence of structural segmentation between new construction and resale markets.
- New residential sales (not seasonally adjusted) declined from 55,000 in December to 48,000 in January
- Existing-home sales declined from December but remained within the same constrained range observed throughout 2025
- Builder inventory stayed elevated
- Resale supply remained constrained by mortgage rate lock-in
The market did not move in one direction. It separated again into two distinct liquidity environments.
Builders adjusted. Homeowners waited.
New Home Sales: Demand Proved Conditional
According to the U.S. Census Bureau and HUD, 48,000 new homes were sold in January 2026 on a not seasonally adjusted basis, down from 55,000 in December.
These figures reflect actual transactions during the month. They are not annualized projections.
New Residential Sales (Not Seasonally Adjusted)
| Metric | December 2025 (Revised) | January 2026 | MoM Change |
|---|---|---|---|
| Homes Sold | 55,000 | 48,000 | -12.7% |
| Homes For Sale | 474,000 | 476,000 | +0.4% |
| Median Sales Price | $419,200 | $400,500 | -4.5% |
Transaction volume declined while inventory held steady to slightly higher. That combination signals demand sensitivity rather than supply constraint.
Buyers responded in December when affordability was engineered. In January, that response weakened.
Regional Breakdown — New Residential Sales (NSA)
| Region | January 2026 Homes Sold |
|---|---|
| South | 29,000 |
| West | 11,000 |
| Midwest | 6,000 |
| Northeast | 2,000 |
The South remained the primary volume driver, but overall activity declined across most regions. Incentive-driven absorption remains the primary mechanism supporting new construction.
New Construction: Structural Supply Metrics (Seasonally Adjusted)
| Metric | December 2025 (Revised) | January 2026 |
|---|---|---|
| SAAR | 712,000 | 587,000 |
| Homes For Sale (SA) | 474,000 | 476,000 |
| Months’ Supply | 8.0 | 9.7 |
Months’ supply expanded materially in January. This was not driven by a surge in new listings. It was driven by slower absorption.
Separating NSA closings from SA structural metrics clarifies the dynamic. Actual transactions declined while underlying inventory pressure increased.
New vs. Existing Home Sales Volume (12-Month View)
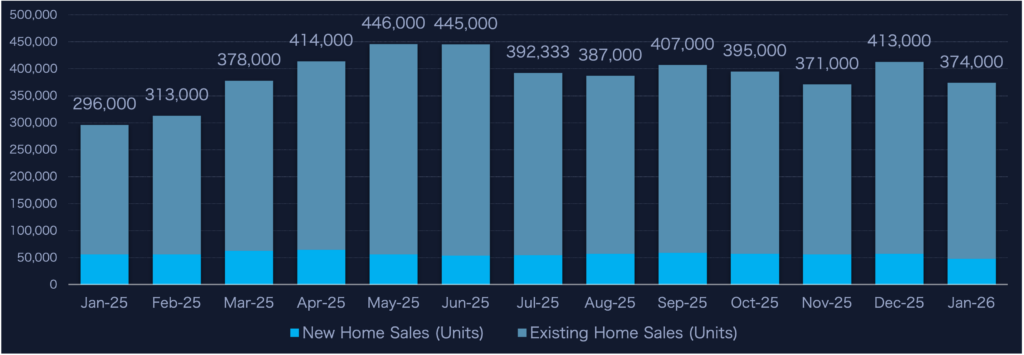
The 12-month view shows that January 2026 home sales did not continue December’s improvement evenly across segments.
New construction activity remains variable and incentive-driven. Resale activity remains stable but constrained. The gap between the two persists.
Existing Home Sales: Decline from Year-End Levels, Structural Constraints Remain
Existing-home sales declined from December levels but remained within the same constrained range observed throughout 2025.
Turnover remains materially below long-term norms despite periodic improvements.
Existing Home Sales — January 2026
| Metric | December 2025 | January 2026 |
|---|---|---|
| Existing Home Sales (SAAR) | 4.27M | 3.91M |
| Median Existing Price | $382,600 | $396,800 |
| Year-over-Year Price Change | +4.4% | +0.9% |
Pricing remained supported by limited supply, even as transaction volume declined from year-end levels.
This reflects the same structural constraint that defined 2025. Homeowners are not forced sellers, and many remain anchored to significantly lower mortgage rates.
Inventory Conditions: Divergence Continues
Inventory dynamics in January remained segmented.
| Indicator | January 2026 |
|---|---|
| New Home Inventory | Elevated (476,000 SA) |
| Existing Inventory | Gradually improving |
| Months’ Supply (New) | 9.7 |
| Seller Behavior | Selective |
Builders continued to manage inventory actively through pricing and incentives. Homeowners continued to manage inventory passively through inaction.
This distinction remains central to understanding transaction flow.
Regional Trends: January 2026 Update
| Region | Inventory YoY | Price Trend YoY | Days on Market |
|---|---|---|---|
| West | Elevated | Softening | Higher |
| South | Stable to elevated | Flat | Slightly higher |
| Midwest | Limited expansion | Flat to modest gains | Stable |
| Northeast | Tight | Modest gains | Slightly higher |
Regional dispersion remains intact. Markets with higher inventory continue to absorb pricing pressure first, while constrained regions maintain relative stability.
Mortgage Rates & Affordability
Mortgage rates remained in the mid-6% range entering 2026.
That level continues to support new-home transactions through builder incentives while suppressing resale turnover through homeowner lock-in.
Affordability remains the dominant gating variable across both segments. Small changes in financing conditions continue to drive disproportionate changes in transaction volume.
Market Implications Heading Into Q1 2026
January 2026 home sales confirmed that demand remains conditional, builders remain the primary source of transaction flexibility, and resale turnover remains structurally constrained.
Inventory expansion does not guarantee absorption. Activity responds to affordability, not availability.
The housing market is not frozen. It is selective, segmented, and highly responsive to pricing and financing mechanics.
For broader historical perspective, explore Dark Sky Data’s prior housing transaction analysis in our Home Sales archive.
WHAT TO DO NOW: CHANNEL PLAYBOOKS (DATA-ALIGNED)
IF YOU MARKET DIRECT-TO-CONSUMER (DTC)
- Focus on markets where builder-driven activity is still occurring
- Target price-sensitive buyers and affordability-driven segments
- Frame messaging around payment certainty and cost control
Demand responds to engineered affordability, not macro sentiment.
IF YOU WORK WITH REAL ESTATE AGENTS
- Prioritize Midwest and Northeast markets where pricing remains stable
- Position warranties as deal-protection and negotiation tools
- Support agents with inspection-risk and pricing-pressure messaging
In a constrained turnover environment, conversion efficiency matters more than volume.
IF YOU PARTNER WITH BUILDERS
- Align with incentive-driven transaction environments
- Integrate protection with financing strategies
- Focus on higher-inventory communities where absorption is active
Builders remain the most adaptable liquidity mechanism in the current cycle.
Data Revision Disclosure
Housing market statistics are frequently revised as additional survey responses are collected and seasonal adjustment models are updated.
The U.S. Census Bureau and the National Association of REALTORS® routinely revise prior-month data, including sales volume, inventory levels, and pricing metrics. As a result, figures cited in this analysis may differ from those reported in prior monthly releases.
Unless otherwise noted, this analysis reflects the most current data available at the time of publication.
Data Sources
This analysis draws on January 2026 data from:
- U.S. Census Bureau — New Residential Sales
- U.S. Department of Housing and Urban Development
- National Association of REALTORS® — Existing Home Sales
- Federal Reserve Economic Data (FRED)
- HousingWire
- Realtor.com
- Redfin
- Regional MLS and state REALTOR® associations