
May 2025 Home Sales: A Market in Motion, Not in Freefall
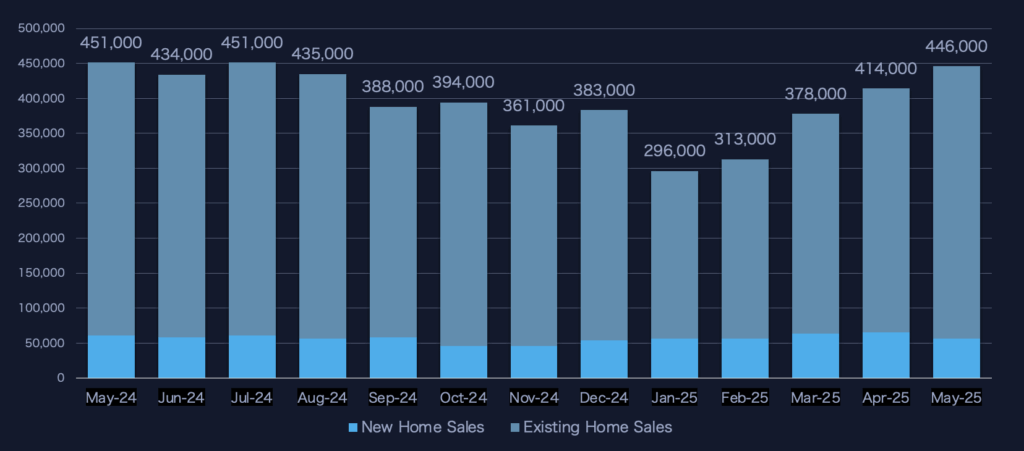
Home sales in May 2025 reflected a market at a crossroads—nudging upward in some areas while falling back in others. On the surface, total U.S. home sales climbed to 446,000 units, up from 414,000 in April. That 7.7% month-over-month bump sounds like momentum. But look closer, and the picture’s more complex.
Behind the headline numbers lies a tale of diverging trends: new home sales slipped significantly, while existing home transactions gained ground. And at the state level, especially among the five highest-volume states, the real story emerges.
The National Picture: Volume Up, But Unevenly
| Category | April 2025 | May 2025 | MoM Change | YoY Change |
|---|---|---|---|---|
| New Home Sales | 65,000 | 56,000 | -13.8% | -8.2% |
| Existing Home Sales | 349,000 | 390,000 | +11.7% | 0.0% |
| Total Home Sales | 414,000 | 446,000 | +7.7% | -1.1% |
The May jump in total sales was powered almost entirely by existing homes. Inventory rose, buyers moved faster, and cash deals increased. But that came as new home sales posted a 13.8% decline month-over-month. It’s the sharpest monthly drop in new construction activity since early 2024—likely a signal of builder caution in the face of stubbornly high mortgage rates.
Why Existing Sales Rose in May
A few key tailwinds pushed existing home sales higher:
- Inventory Growth: Unsold listings climbed 6.2%, hitting 1.54 million homes nationwide. More choices mean more transactions.
- Time-on-Market Decline: Homes sold 2 days faster on average, improving deal velocity.
- Regional Strength: Gains in the Northeast (+4.2%), Midwest (+2.1%), and South (+1.7%) outpaced the 5.4% decline in the West.
- Cash Buyers Stepping In: The share of cash sales jumped to 27%, up from 25% in April.
That last point is key for DTC marketers: cash buyers are less rate-sensitive and more responsive to urgency and value messaging. If your funnel doesn’t segment by payment method or financial profile—you’re missing the mark.
Top Five States in May: Florida Still Dominates
Among states with publicly available, reliable monthly data, five states stood out in May 2025 for total existing home sales:
| State | May Sales Volume | Change from April | Notes |
|---|---|---|---|
| Florida | 33,101 | +5.9% | Single-family + condo/townhouse |
| Illinois | 12,674 | +7.4% (est.) | Includes SFH + condos |
| Georgia | 12,249 | +6.8% (est.) | Closed sales statewide |
| Pennsylvania | 10,635 | +5.3% (est.) | Home sales statewide |
| New York | 7,846 | +3.7% (est.) | Closed sales statewide |
Note: % change estimates are directional based on local trends and historical pacing. Final numbers may vary.
Florida: Still the Market to Beat
Florida’s dominance continues, posting 33,101 closed sales—nearly triple the next state. The sunshine state benefits from in-migration, investor demand, and a larger condo market that helps buffer rate sensitivity. Single-family homes accounted for 24,756 units; condos and townhouses added another 8,345.
If you’re a marketer focused on retirement, snowbird relocation, or investor-driven products like home warranties and appliance protection—Florida’s conversion cost will be lower when your campaigns are tuned to this dual-market demand.
Illinois and Georgia: Close Contenders
Illinois and Georgia came in neck-and-neck, with over 12,000 sales each. Both states offer urban and suburban diversity and have seen upticks in affordability-related relocations from higher-cost markets. These are strong battlegrounds for marketers seeking middle-income buyers who move fast when inventory opens up.
New Entrants and Dropouts
New York remained in the top five, but just barely—edging out states like Texas, North Carolina, and Ohio, where only local metro-level data is available. If broader reporting were consistent, Texas could likely challenge for a top-five spot. In Houston alone, over 9,000 single-family homes closed in May, and Austin added another 3,000+. But without statewide coverage, they remain undercounted.
New Home Sales: A Sharp Retreat
Despite strength in existing homes, new construction sales fell to 56,000 units, a 13.8% decline from April. This drop is significant and follows an unusually strong spring start. Builders may be responding to:
- Affordability squeeze: Buyers balking at high rates and limited incentives.
- Inventory pressures: Many builders are now prioritizing margin over volume.
- Permitting delays and cost concerns: Especially in coastal and Sun Belt metros.
For DTC marketers relying on new move-in triggers, this means fewer fresh starts and more churn in resale. Consider adjusting your direct mail cadence, as the expected pace of new-home-driven household formation may slow into Q3.
Year-over-Year Lens: Still Below 2024
Compared to May 2024, total home sales are down slightly—446,000 vs. 451,000. The culprit? New home sales are down over 8%, and total activity is 1.1% below last year’s mark. Existing home sales, interestingly, held flat year over year.
May 2025 edged out May 2024 as the slowest May for total home sales since 2009—a sign that despite inventory gains, we’re still in historically sluggish territory.
The key takeaway: we’re not crashing—but we’re not accelerating, either.
What This Means for Marketers
If you sell to new movers—home warranties, appliance subscriptions, pest control, telecom—the May 2025 data carries three clear implications:
1. Track Regional Trends, Not Just National Rates
Florida, Illinois, and Georgia continue to outperform. Targeting campaigns by ZIP code heat maps of sales activity (rather than national averages) will increase your conversion odds.
2. Don’t Over-Rely on New Construction
With new home sales falling 13.8% in a single month, marketers tied to builder partnerships or new-home pipelines should brace for slower Q3 lead flow. Shift budgets toward resale-heavy counties where listings are rising and days-on-market is falling.
3. Segment for Cash Buyers
With all-cash sales rising, it’s essential to understand buyer financing profiles. Campaigns aimed at mortgage-dependent buyers may underperform in high-rate environments. Adjust offer timing and value props for more equity-rich, liquidity-ready segments.
Looking Ahead
June 2025 could be even more telling. Will the rebound in existing home sales hold, or was May a temporary inventory bounce? Will builder incentives return to boost new home sales in Q3? Early signs from listing services suggest that June brought more delistings and slightly longer DOM in the West—a red flag for deal volume.
What’s clear is this: we are in a market that rewards nuance and punishes lazy segmentation.
If you’re still mailing the same list you used in Q1, you’re behind.
Click here to find out how Dark Sky Data can help you take advantage of the changing market.
Key Takeaways
- Total U.S. home sales rose 7.7% in May 2025 vs. April, reaching 446,000 units.
- New home sales fell 13.8% month-over-month and are down 8.2% year-over-year.
- Existing home sales rose 11.7% vs. April and held flat year-over-year.
- Top states by volume: Florida (33,101), Illinois (12,674), Georgia (12,249), Pennsylvania (10,635), and New York (7,846).
- Inventory, cash buyers, and regional differences are driving sales more than national trends.
- Marketers should target by region, payment method, and home type to stay competitive.
Sources
- U.S. Census Bureau – Monthly New Residential Sales, May 2025
- National Association of REALTORS® (NAR) – Existing Home Sales Report, May 2025
- Florida Realtors®, May 2025 Market Data
- Illinois REALTORS®
- Georgia Association of REALTORS®
- Pennsylvania Association of Realtors®
- NY State Association of REALTORS®
- Houston Association of REALTORS®
- Austin Board of REALTORS®
- California Association of REALTORS®
- Sacramento Association of REALTORS®
- Columbus REALTORS®
- Dayton REALTORS®
- Triangle MLS
- Neuse River Region Association of REALTORS®