Why Blended Cancellation Curves Are Misleading
If you’re relying on cancellation curves from your payment plan provider—like PayLink, Mepco, or Walco—you’re only seeing part of the story.
Those blended curves are useful for tracking total portfolio performance. But they won’t tell you why cancellations are happening.
Because they don’t show you the differences that matter. The only way to do that? Segment the data.
The illusion of a healthy portfolio
A blended cancellation curve lumps every contract—across every source, product, and plan—into one trend line. On paper, it might look like your business is performing just fine.
But under the surface?
- One marketer is generating contracts that flat-cancel 3x more often
- That new down payment offer is driving early churn
- A rep is closing deals that don’t stick past Month 2
Blended curves smooth over these problems. They hide volatility. They mask margin loss. And they delay action until it’s too late.
Cancellation is not random
Customers don’t cancel randomly. Certain campaigns cancel faster. Certain reps oversell. Certain finance terms drive higher attrition.
When you rely on a blended curve, you can’t see any of that.
You can’t isolate underperformers. You can’t test changes. You can’t fix what’s broken—because you don’t know what’s broken.
Blended = blurred
Imagine trying to fix your vision with someone else’s glasses. That’s what a blended curve is like: a blurry average that fits no one.
What you need is segmentation.
Segment by:
- Marketer or lead source
- Down payment tier
- Payment plan type
- Product or state
- Sales rep or finance partner
Now you can see which cohorts cancel early—and act before it hits your loss ratio.
The fix: Experience Curves that segment fast
Dark Sky Data’s Experience Curve tool breaks the blended habit. Upload your Excel file, align contracts to Month 1, and filter by any column in your data.
You’ll instantly see:
- When and where churn is concentrated
- Which terms or reps are dragging your retention
- What’s working—and what’s not
Because in this business, it’s not just about knowing what’s happening. It’s about knowing why—and moving fast enough to do something about it.
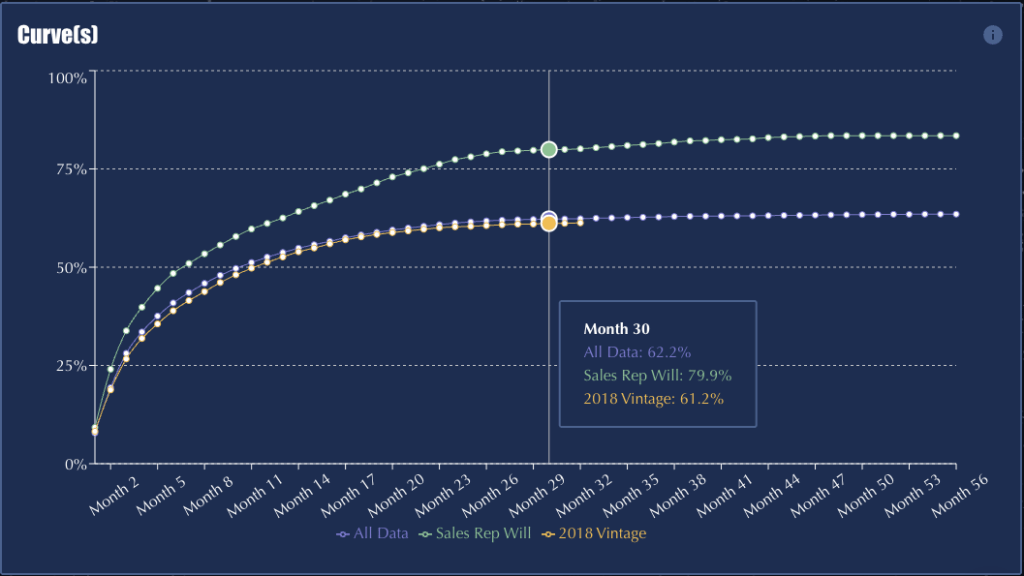
In the curves shown, the portfolio has a cancel rate of 62.2%—this is the blended rate you receive from your payment plan provider. But when you dig deeper, you see that Sales Rep William has a cancellation rate of 79.9%. His impact gets buried in the average—impossible to see unless you segment the data.
Don’t wait for another company to tell you your cancels are high
Let’s get ahead of it.
Use Dark Sky Data’s Experience Curve to build an earnings curve that reflects how your products actually perform—so your numbers work for you, not against you. Learn more about the Experience Curve.
Do you want to learn more about selling your F&I company? Check out information on the F&I industry and M&A research at Colonnade Advisors.