Why Vintage Analysis Matters in Understanding Cancellations
If you’re only looking at your overall cancellation rate, you’re missing the real story.
Cancellation behavior isn’t static. It shifts over time—and across different groups of contracts. That’s why you need to break it down by vintage.
“A vintage is a group of contracts that started in the same period—typically a month, quarter, or. It’s a timing cohort, and it matters because products, pricing, lead sources, and customer behavior often change over time. By comparing vintages, you isolate timing effects and spot early signals of churn that get buried in your blended numbers”.
Take a look at your originations from Q2 of this year. How do they perform compared to Q2 from last year? Same product, same general season—but is the behavior the same?
Probably not. And that’s where vintage analysis becomes essential.
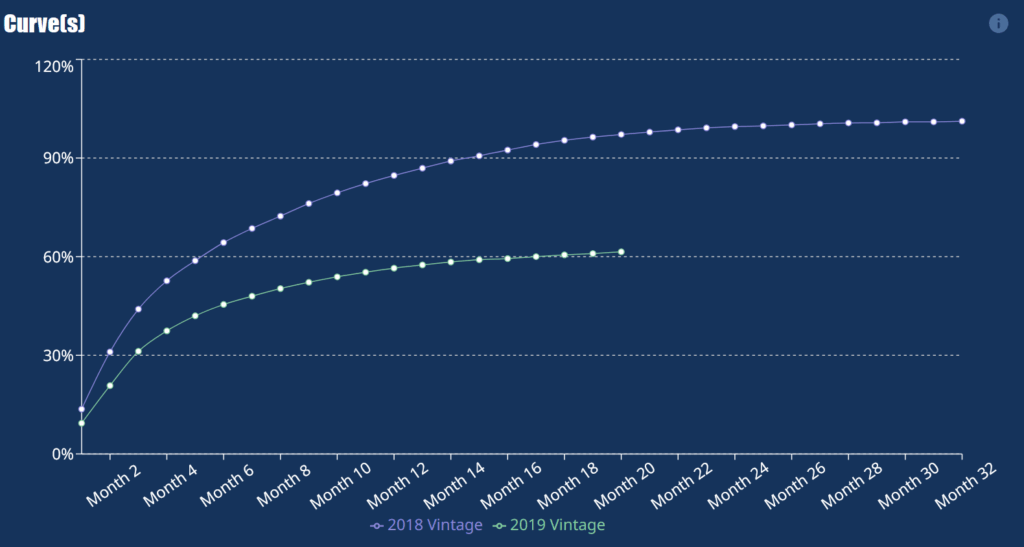
When you graph cancellation curves by vintage, two things matter most: the intercept and the slope.
- The intercept is your starting point. It tells you how many contracts are canceling in the first month or two after sale. A high intercept means high flat cancels. That could point to aggressive closers, misaligned marketing, or bad fits at the top of the funnel.
- The slope shows how fast cancellations pile up over time. A steeper slope means contracts are continuing to cancel at a higher rate, even after the initial risk period. That could signal weak product pricing structure, poor customer onboarding, or unresolved service issues.
Now compare across vintages:
- If the intercept is higher and the slope is similar, you’re worse off from the start. You’re losing more customers immediately—even if long-term performance holds.
- If the intercept is flat but the slope is steeper, you’re still in trouble. Cancellations are accelerating after launch, which often goes unnoticed until margins are hit.
Blended cancellation rates mask both of these issues. They mix all contracts—old and new—into one average line. That makes it impossible to tell whether a problem is new or persistent, early or late, channel-specific or systemic.
Vintage curves solve this. They align contracts by Month 1, so you can compare behavior over time, apples to apples. You’ll see when risk is creeping earlier, when retention is sliding later, and when your newest cohorts just aren’t holding like they used to.
It’s not about slicing data endlessly—it’s about seeing the signal in the noise.
Vintage analysis lets you do that.
And with tools like the Experience Curve from Dark Sky Data, you can build these insights in seconds—no analysts, no code, no waiting on IT.
Try the Experience Curve now. Your first 24 hours are free: https://darkskydata.com/getstarted/