
November 2025 Home Sales: Divergence Reinforced
Reflecting the most recent U.S. Census Bureau and NAR releases (November 2025) | Published February 2026
November 2025 home sales did not signal a broad housing recovery. They clarified the structure of the market heading into 2026.
Buyer demand remained payment-sensitive. Resale turnover remained constrained by homeowner lock-in. Builders continued adapting through pricing flexibility and incentives to sustain transaction flow.
Viewed from February 2026, November reads less like an inflection and more like confirmation: housing was not frozen, it was segmented.
For prior context, see our analysis of October 2025 Home Sales, where this structural divergence first became clear.
November 2025 Home Sales at a Glance: Two Markets, Continued Divergence
| Metric | New Homes | Existing Homes |
|---|---|---|
| Monthly Closings | ~56,000 | ~315,000 |
| SAAR Sales Volume | ~758,000 | 4.13 million |
| Median Sale Price | ~$392k range | $409,200 |
| YoY Price Change | Flat to modest declines | +1.2% |
| Inventory Conditions | Elevated | Moderately constrained |
Why it mattered:
New construction continued to manage sales velocity through pricing flexibility and incentive deployment, while existing-home transactions remained structurally limited despite modest rate relief. The imbalance persisted.
November 2025 Home Sales: New vs. Existing
The defining feature of November 2025 home sales was continued separation between new construction and resale housing.
- New residential sales (not seasonally adjusted) increased nearly 10% month-over-month.
- Existing-home sales improved modestly but remained below long-term turnover norms.
- Inventory growth slowed in resale markets.
- Builders retained pricing flexibility; homeowners retained optionality.
The market did not broadly reaccelerate. It continued operating in two distinct liquidity systems.
New Home Sales: Builders Sustained Activity
According to the U.S. Census Bureau and HUD, 56,000 new homes were sold in November 2025 (not seasonally adjusted), up from 51,000 in October.
These are actual monthly transactions — not annualized extrapolations.
New Residential Sales (NSA)
| Metric | October 2025 | November 2025 | MoM Change |
|---|---|---|---|
| Homes Sold | 51,000 | 56,000 | +9.8% |
| Homes For Sale | 481,000 | 490,000 | +1.9% |
| Months’ Supply | 9.4 | 8.8 | Improving |
Inventory remained elevated relative to resale markets, but absorption improved. Months’ supply compressed modestly — indicating demand responsiveness where pricing and financing levers were available.
Regional Breakdown — New Residential Sales (NSA)
| Region | November 2025 Homes Sold |
|---|---|
| South | 34,000 |
| West | 11,000 |
| Midwest | 6,000 |
| Northeast | 5,000 |
The South remained the primary volume driver. Incentives and rate buydowns continued influencing transaction flow across major growth corridors.
New vs. Existing Home Sales Volume (12-Month View)
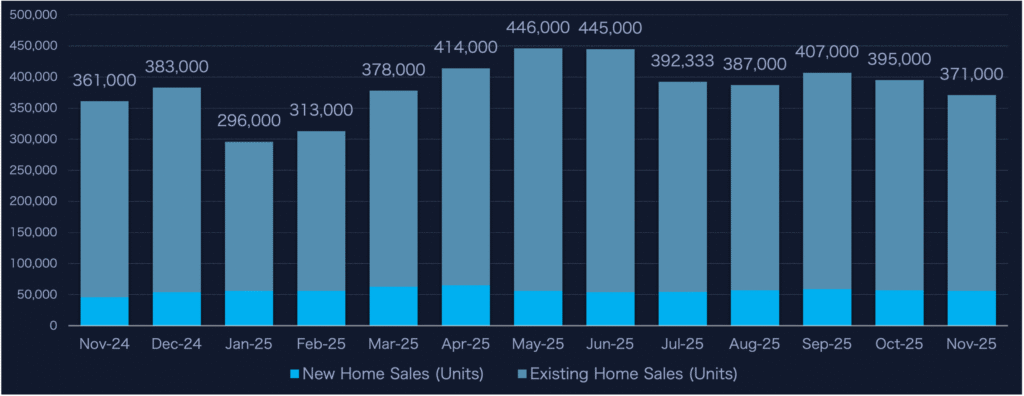
The 12-month view underscores that November did not mark a reversal. It reinforced the structural separation between builder-managed liquidity and resale-constrained turnover.
While resale homes continued to account for the majority of transactions, new construction played an outsized role in sustaining deal flow — particularly in higher-inventory regions.
Existing Home Sales: Incremental Improvement, Structural Limits
The National Association of REALTORS® reported 4.13 million SAAR in existing-home sales for November 2025, up from approximately 3.96 million in October.
Despite that improvement, turnover remained materially below long-term norms.
Existing Home Sales — November 2025
| Metric | October 2025 | November 2025 |
|---|---|---|
| Existing Home Sales (SAAR) | ~3.96M | 4.13M |
| Median Existing Price | ~$406,000 | $409,200 |
| Year-over-Year Price Change | +3.4% | +1.2% |
Pricing remained relatively firm even as volume stayed constrained. The deceleration in price growth reflects gradual normalization, not broad repricing.
Limited resale inventory continued to provide price support, offsetting affordability pressures that would otherwise have weighed more heavily on valuations.
Regional Trends: November 2025 Update
| Region | Inventory YoY | Price Trend YoY | Days on Market (Trend) |
|---|---|---|---|
| West | Moderating growth | Softening | Higher |
| South | Slowing expansion | Flat to modest gains | Slightly higher |
| Midwest | Stable | Flat | Stable to slightly higher |
| Northeast | Limited growth | Flat to modest gains | Slightly higher |
What changed from earlier in 2025:
Inventory growth continued across most regions but at a slower pace than mid-year levels. Days on market remained elevated relative to early 2025, while pricing pressure eased most in regions where inventory had expanded earlier in the cycle.
The imbalance persisted — but it moderated.
Inventory Conditions: A Conditional Recovery
Active listings declined modestly month-over-month in November, interrupting what had been a gradual rebuilding trend throughout 2025.
| Indicator | November 2025 |
|---|---|
| Active Listings MoM | -1.4% |
| Sale-to-List Spread | ~1.6% below list |
| Existing Months’ Supply | Elevated vs. 2024 |
Inventory recovery became conditional. Sellers who did not achieve acceptable pricing frequently withdrew rather than materially reprice. Builders, by contrast, retained flexibility to adjust incentives dynamically.
Mortgage Rates & Affordability
Mortgage rates eased into the low-6% range in November. That modest relief supported new-home absorption, particularly where rate buydowns were deployed.
It did not materially unlock resale supply, where many homeowners remained anchored to significantly lower legacy mortgage rates.
Affordability remained the dominant gating variable across segments.
Market Implications Heading Into 2026
As 2025 closed, the housing market remained defined by imbalance rather than momentum.
Slightly lower mortgage rates helped stabilize activity at the margin — but not enough to unlock a broad resale recovery.
For organizations tied to housing transactions, the takeaway remains consistent: opportunity continues to skew toward builder-driven volume and resale-light regions where transactions are actually occurring.
For broader historical perspective, explore Dark Sky Data’s prior housing transaction analysis in our Home Sales archive.
WHAT TO DO NOW: CHANNEL PLAYBOOKS (DATA-ALIGNED)
IF YOU MARKET DIRECT-TO-CONSUMER (DTC)
- Focus on metros where new residential absorption is improving but resale turnover remains constrained
- Target builder buyers and price-sensitive move-ups
- Frame messaging around payment predictability and post-closing protection
Demand remains payment-sensitive. Messaging should align with affordability engineering, not speculative appreciation narratives.
IF YOU WORK WITH REAL ESTATE AGENTS
- Prioritize Midwest and Northeast markets where pricing remains comparatively stable
- Position warranties as offer-strength tools or seller-paid differentiators
- Support agents with pricing-pressure and inspection-risk messaging
Conversion efficiency matters more than volume assumptions in a constrained turnover environment.
IF YOU PARTNER WITH BUILDERS
- Bundle warranties with closing incentives and mortgage buydowns
- Position coverage as part of affordability, not an add-on
- Focus on higher-inventory communities where incentives are already active
Builders remain the most adaptable liquidity engine in the current cycle.
Data Sources
This analysis draws on November 2025 data from:
- U.S. Census Bureau & U.S. Department of Housing and Urban Development — New Residential Sales Report
- National Association of REALTORS® — Existing Home Sales Report
- Federal Reserve Economic Data — Existing Home Sales Tables
- Redfin, Realtor.com, and regional MLS data
About Dark Sky Data
Dark Sky Data provides housing, economic, and property intelligence designed to help home warranty providers, administrators, and real estate professionals anticipate demand, segment markets accurately, and allocate resources with confidence.
National headlines blend markets. We isolate them.