May 12

The Weekly Curve: CLIP Structure, Earnings Curves, and Reserve Timing for Warranty Administrators

Issue No. 6 | May 12, 2026 For warranty administrators who manage loss ratios, reinsurance, and contract performance. This Week: Clip Structure And Reserve Positioning THE STATISTIC: B+ B+ is the AM Best financial strength rating that states generally require of CLIP insurers backing VSC and ancillary warranty programs. That threshold is the minimum regulatory […]
May 5

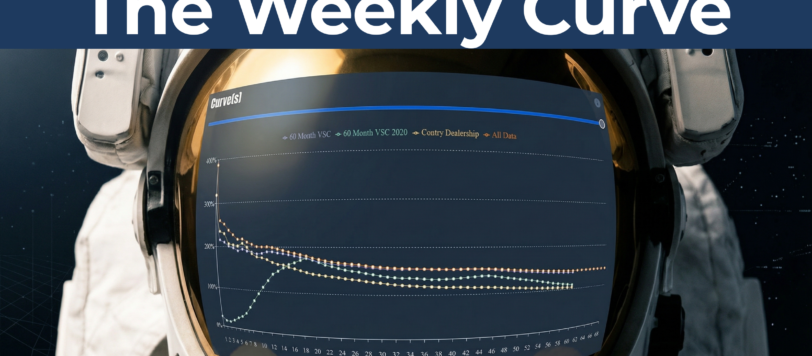
The Weekly Curve: AI Is Catching Warranty Claim Deficiencies at Nearly Double the Rate of Manual Review

Issue No. 5 | May 5, 2026 For warranty administrators who manage loss ratios, reinsurance, and contract performance. This Week: The Claims Intelligence Shift THE CURVE: 25% to 42% AI warranty claims processing is identifying deficiencies in 42% of reviewed claims, up from roughly 25% in manual workflows, per MSX International data cited in Colonnade […]

May 5

The Dealership Brief: AI Is Delivering 27% More Showroom Appointments and the Buyer at Your F&I Desk Has Already Changed

Issue No. 5 | May 5, 2026 Intelligence for F&I agents, administrators, and dealership finance professionals. THE VEHICLE MARKET NUMBER: 27% That is the increase in showroom appointment rates among franchised dealers using AI-driven intent scoring, per Colonnade Advisors’ DealerTech M&A Landscape report (March 2026). The floor traffic arriving at F&I desks in AI-enabled stores […]

May 5

The Direct Marketing Brief: The AI Infrastructure Around Warranty Marketing Is Moving From Competitive Advantage to Compliance Requirement

Issue No. 5 | May 5, 2026 Intelligence for direct marketers in insurance, home services, warranty, and protection. This Week: The AI Infrastructure Shift THE NUMBER: 13.9% That is how much auto repair and maintenance costs have risen since August 2022, per BLS, compared to 5.6% for general CPI over the same period. The average […]

Apr 28

The Weekly Curve: Your Participation Structure Determines Your Exposure and Your Reporting Determines Whether You See It

Issue No. 4 | April 28, 2026 For warranty administrators who manage loss ratios, reinsurance, and contract performance. This Week: The DTC Channel and Your Book THE CURVE: 12.3% The DTC VSC channel is growing at a 12.3% CAGR, per Colonnade Advisors’ March 2026 whitepaper. That is the top-line number. The one that matters for […]

Apr 28

The Direct Marketing Brief: Only 44% of Eligible Vehicles Have Coverage and How to Find Volume and Keep It in a Mostly Uncovered Market

Issue No. 4 | April 28, 2026 Intelligence for direct marketers in insurance, home services, warranty, and protection. This Week: The Coverage Gap THE NUMBER: 44% Only 44% of eligible U.S. vehicles carry VSC coverage, per Colonnade Advisors’ March 2026 whitepaper. Set against approximately 296.5 million passenger vehicles on U.S. roads, roughly 70% of which […]

Apr 28

The Dealership Brief: 55% of Buyers Leave Without VSC Coverage and Why That Is a Remarketing Opportunity, Not a Closed Door

Issue No. 4 | April 28, 2026 Intelligence for F&I agents, administrators, and dealership finance professionals. THE VEHICLE MARKET NUMBER: 45% Only 45% of new car buyers purchase a VSC at the point of sale, per NADA industry data cited in Colonnade Advisors’ March 2026 whitepaper. At an average selling price of $48,205 and a […]

Apr 21

The Weekly Curve: Warranty Repair Severity Has Compounded at 7% Since 2018 and Most Pricing Models Have Not

Issue No. 3 | April 21, 2026 For warranty administrators who manage loss ratios, reinsurance, and contract performance. This Week: The Compounding Repair Cost Base THE CURVE Service and parts sales per warranty repair order at franchised dealerships have grown from $343 in 2018 to $551 in 2025. That is a 60% increase over seven […]

Apr 21

The Direct Marketing Brief: A Record 27% of Trade-Ins Are $10,000 Underwater and Why the Used Vehicle Buyer Is Your Next Acquisition Cohort

Issue No. 3 | April 21, 2026 Intelligence for direct marketers in insurance, home services, warranty, and protection. This Week: The Affordability Handoff THE NUMBER: 27% A record 27% of underwater trade-ins now carry $10,000 or more in negative equity, per Edmunds Q4 2025. That is an all-time high. The average underwater balance sits at […]

Apr 21

The Dealership Brief: 114 Cars Per Salesperson, $48K Average Transactions, and Why F&I Margin for Error Has Never Been Smaller

Issue No. 3 | April 21, 2026 Intelligence for F&I agents, administrators, and dealership finance professionals. THE VEHICLE MARKET NUMBER: 114 Average new-vehicle retail sales per new-vehicle salesperson hit 114 in 2025, the highest mark in an eight-year window and up from 102 in 2022 (NADA Data 2025). Dealerships are moving roughly 12% more cars […]