
May 2026 New Home Sales: Volume Retreats, Supply Builds
Reflecting the most recent U.S. Census Bureau and HUD release (May 2026) | Published June 2026
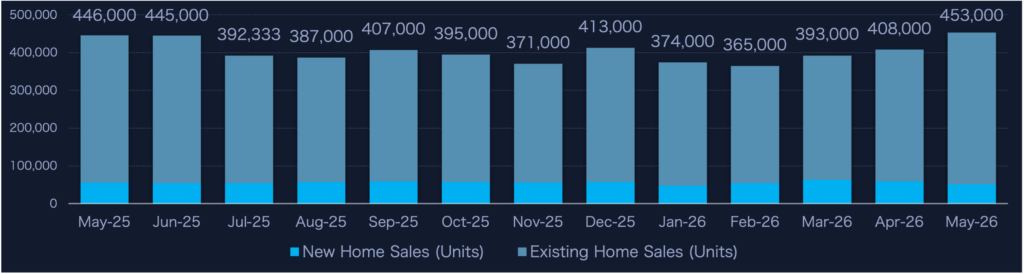
The spring selling season failed to deliver. May 2026 new home sales came in at a seasonally adjusted annual rate of 580,000 — down 7.3% from April’s revised 626,000 and 6.8% below the May 2025 pace of 622,000. That puts May just above January’s 576,000 SAAR, the year’s low point. Rather than building on Q1’s recovery, the market gave most of it back: inventory expanded, months’ supply climbed to its highest level of 2026, and the year-to-date deficit versus 2025 widened to 7.0%.
What held was pricing. The median sale price of $424,900 was essentially flat with May 2025 — a marked departure from Q1’s steep year-over-year declines. The data suggests builders prioritized pricing over volume, accepting fewer closings rather than broadly discounting to sustain activity.
For prior context, see our analysis of March 2026 Home Sales and additional reporting in our Home Sales archive.
Key Takeaways
- New home sales fell to 580,000 SAAR, reversing much of the spring rebound.
- Inventory reached 496,000 homes while months’ supply climbed to 10.3, the highest reading of 2026.
- Median prices held essentially flat year over year despite weaker sales activity.
May 2026 New Home Sales at a Glance
| Metric | May 2026 | April 2026 | May 2025 |
|---|---|---|---|
| SAAR | 580,000 | 626,000 | 622,000 |
| Homes Sold (NSA) | 51,000 | 59,000 | 56,000 |
| Homes For Sale (SA) | 496,000 | 485,000 | 503,000 |
| Months’ Supply | 10.3 | 9.3 | 9.7 |
| Median Sales Price | $424,900 | $416,500 | $424,800 |
Volume retreated to near-cycle lows as months’ supply crossed 10.0 for the first time in 2026. Yet the median price held flat year-over-year — a reversal of the downward pricing trajectory that characterized Q1. The spring market underperformed on volume without offering price relief.
A Revised Look at Q1 and Q2
This release included revisions to prior months that reshape the Q1 story. March 2026 was revised down from the preliminary 682,000 SAAR to 664,000. April 2026, reported here for the first time, came in at 626,000 — a deceleration that set up May’s further decline.
| Month | SAAR | Notes |
|---|---|---|
| January 2026 | 576,000 | Revised |
| February 2026 | 630,000 | Revised |
| March 2026 | 664,000 | Revised down from 682,000 |
| April 2026 | 626,000 | First estimate |
| May 2026 | 580,000 | Preliminary |
The revised sequence makes the arc unmistakable: what looked like a spring acceleration in the preliminary March read has resolved into three consecutive months of deceleration. The Census Bureau notes it takes four months to establish a trend — by that measure, the Q1-into-Q2 arc is pointing downward.
On an unadjusted basis, 51,000 homes closed in May — 9% below the year-ago figure of 56,000. March was revised to 63,000 (from 64,000 preliminary) and April came in at 59,000. Year-to-date through May, 275,000 new homes have been sold, down 7.0% from 296,000 over the same period in 2025. That deficit is widening rather than stabilizing.
Regional Picture: Two Markets Diverging
The South and West both declined from year-ago levels in May — the South delivered 31,000 closings against 33,000 in May 2025, while the West fell from 13,000 to 10,000. The Midwest held flat at 7,000. The Northeast was the only region to post year-over-year growth, though at 3,000 units it represents a small share of national volume.
On a seasonally adjusted basis, the West’s deterioration was particularly sharp: down 26.9% month-over-month, from 160,000 SAAR in April to 117,000 in May. The West is the region most sensitive to affordability and rate movements, and that sensitivity is showing in the data.
Year-to-date trends widen the divide further. The Midwest (+4.2%) and Northeast (+1.9%) are both running ahead of 2025 pace — the two regions where housing costs remain more accessible relative to incomes. The South, which accounts for the majority of U.S. new home transactions, has deteriorated sharply, with a -8.2% YTD gap that represents a meaningful headwind for national totals. The West’s -11.4% YTD trajectory is the weakest of any region, and May’s sequential drop deepened that deficit.
Inventory: The Overhang Builds
Inventory has risen in three of the last four months. From March’s 481,000 seasonally adjusted units, the count climbed to 485,000 in April and 496,000 in May — pushing months’ supply from 8.7 to 9.3 to 10.3 over the same period. The brief compression seen in early spring has fully reversed.
At 10.3 months, the market is carrying more inventory relative to current sales velocity than at any point in this cycle. Equilibrium is typically considered around 6.0 months. The current reading does not reflect a one-time supply spike — it reflects a sustained mismatch between what builders are delivering and what buyers are absorbing at present price levels.
Stage of Construction: Finished Homes Are Sitting
The May decline in closings was concentrated in completed homes, which fell from 33,000 in April to 28,000, while pre-construction activity held roughly flat — not-started at 6,000 and under-construction at 17,000.
That weakness showed up in completions is the key signal. Completed homes carry the heaviest builder incentive programs, and yet buyers remain unwilling to transact at current prices. The median months on market for completed homes reached 3.7 in May — the highest reading of this cycle and 54% above the 2.4 months recorded in May 2025. Finished inventory is taking longer to clear than at any point in the prior year.
Pricing: Builders Held the Line
The median sales price of new homes sold in May 2026 was $424,900 — up 2.0% from April’s $416,500 and essentially flat with May 2025’s $424,800. The average sales price was $540,600, up 7.8% from April and 5.0% above May 2025.
This is a materially different picture from Q1. In March 2026, the median price was $393,100 — well below year-ago levels. By May, that gap had closed entirely. The May pricing data suggests builders largely held the line on price rather than pursuing the broader price reductions seen earlier in the year.
The price distribution reflects this posture. The sub-$400,000 segment accounted for 45% of May transactions, down from 54% in March, while higher-price-tier volume maintained its share even as total closings fell. That mix shift partly explains why the median recovered from Q1 lows.
| Price Range | Units Sold | Share of Total |
|---|---|---|
| Under $300,000 | 8,000 | 15% |
| $300,000 – $399,999 | 15,000 | 30% |
| $400,000 – $499,999 | 10,000 | 20% |
| $500,000 – $599,999 | 7,000 | 14% |
| $600,000 – $799,999 | 5,000 | 10% |
| $800,000 – $999,999 | 2,000 | 4% |
| $1,000,000 and over | 4,000 | 7% |
Market Implications Heading Into Summer 2026
May’s data raises a question the next few months will need to answer: is this a single-month pullback or the beginning of a sustained softening?
The case for a one-month pause is real. Seasonal patterns are noisy, confidence intervals on the monthly SAAR are wide, and April’s revised 626,000 provides a reasonable spring baseline. But the weight of the evidence points the other direction. Inventory has climbed for three of the last four months. Completed homes are sitting 54% longer than a year ago. The YTD deficit versus 2025 is widening. And the West — historically a leading indicator for national housing direction — dropped sharply in May after already trailing year-ago levels.
Pricing held in May, but that durability is conditional. If volume stays soft through summer, the carrying cost of sitting inventory will intensify, and builders will face the same choice they confronted in Q1: absorb the cost or discount to close.
For broader historical context, explore Dark Sky Data’s prior housing transaction analysis in our Home Sales archive.
WHAT TO DO NOW: CHANNEL PLAYBOOKS (DATA-ALIGNED)
IF YOU MARKET DIRECT-TO-CONSUMER (DTC)
The sub-$400,000 segment still accounts for 45% of transactions — that is where buyer activity concentrates, and affordability anxiety has not eased. Messaging around payment certainty and protection at closing remains highly relevant. Watch for renewed price incentives from builders if inventory pressure persists through summer — those windows tend to generate short-term volume spikes worth targeting aggressively.
Volume is soft, but buyers haven’t disappeared. They’re waiting for the right price signal.
IF YOU WORK WITH REAL ESTATE AGENTS
The Midwest and Northeast are the only regions posting YTD volume growth — prioritize those markets for consistent deal flow. Completed homes sitting at a median 3.7 months on market represent active listings where builders have meaningful negotiating flexibility; warranties positioned as closing tools fit this environment. As inventory grows and buyer leverage increases, days-on-market messaging and inspection-risk framing become more effective, not less.
In a market where buyers have more time and more options, conversion tools matter more than volume assumptions.
IF YOU PARTNER WITH BUILDERS
Inventory is building and completed homes are sitting longer — builders who move toward Q1-style incentive programs to clear finished inventory will need embedded protection products at closing. The West’s sharp sequential decline warrants direct outreach now: high-inventory, slower-absorption markets are where warranty bundling has historically shown the clearest ROI. Position ahead of the back half of the year; if months’ supply holds above 10.0 into Q3, the pressure to deploy incentives will intensify quickly.
Builders who held price in May may not hold price in August. Be positioned before the incentive window opens.
Data Revision Disclosure
Housing market statistics are subject to revision as additional survey data is collected and seasonal adjustments are updated. The figures reported here for March and April 2026 differ from their initial releases due to standard revisions by the U.S. Census Bureau and HUD. The May 2026 figures are preliminary and will be subject to further revision in subsequent releases. Unless otherwise noted, this analysis reflects the most current data available at the time of publication.
Data Sources
This analysis draws on May 2026 data from:
- U.S. Census Bureau — New Residential Sales (Release CB26-106, June 24, 2026)
- U.S. Department of Housing and Urban Development
- Federal Reserve Economic Data (FRED)