
Retention Analysis Tool Is Live: Customer Persistence Analytics for Private Equity
Dark Sky Data has launched a customer retention analytics platform built to classify every account in a dataset by lifecycle state and measure whether a customer base is expanding, holding, or quietly deteriorating over time.
The platform processes customer-level revenue or unit data directly from Excel or CSV files. It supports monthly and annual analysis, parent and subsidiary structures, units as well as dollar revenue, and outputs metrics including Net Revenue Retention (NRR), Customer Retention Rate (CRR), Expansion Revenue Rate, Contraction Revenue Rate, and account-level lifecycle classification across every period in the dataset.
For private equity firms, operators, and finance teams evaluating customer persistence, the problem is rarely a lack of data. The problem is visibility into what is actually happening underneath blended reporting.
Traditional calendar-based reporting aggregates all customers together regardless of tenure, acquisition channel, product, geography, or vintage. When topline revenue appears stable, it can conceal weakening retention underneath new customer growth. When performance deteriorates, it is often difficult to determine when the deterioration started, which segment caused it, or whether the problem is accelerating.
Blended customer counts and revenue totals describe what happened. They do not isolate why it happened or where it is occurring.
The Retention Analysis Tool was built to make those customer dynamics measurable at the account level.
What the Retention Analysis Tool Produces
The tool processes account-level revenue or unit data and classifies every customer into one of seven lifecycle states for each period:
New – an account generating revenue in the current period that had no revenue in any prior period.
Retained – an account with non-zero revenue that was active in the prior period. The tool captures increasing, flat, and declining sub-states, distinguishing stable retention from expansion or gradual contraction within the existing base.
Returning – an account previously classified as Lost or No Longer a Customer that has re-engaged with non-zero revenue.
Lost – an account that had revenue in a prior period and has had zero revenue in the current period within the inactivity window.
Inactive – an account showing zero revenue in the current period that does not yet meet the threshold for Lost classification.
No Longer a Customer – an account that was Lost and has continued showing zero revenue across all subsequent periods.
Not Yet a Customer – an account present in the dataset with no prior revenue activity.
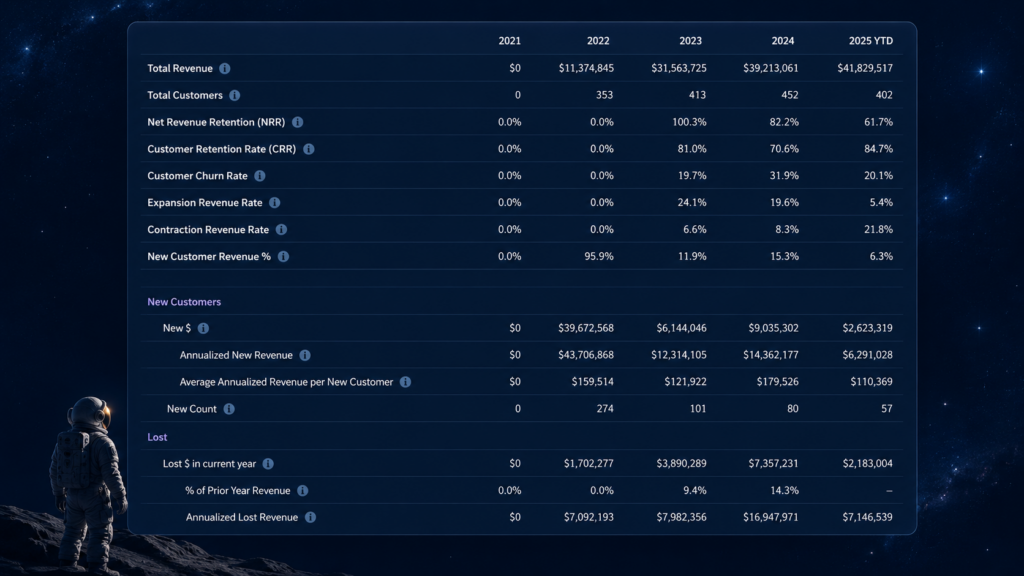
From those classifications, the tool computes the following metrics for every period in the dataset:
- Net Revenue Retention (NRR) – the percentage of prior-period revenue retained, adjusted for expansion and contraction within the existing base
- Customer Retention Rate (CRR) – the share of prior-period customers retained into the current period
- Customer Churn Rate – the share of prior-period customers classified as Lost in the current period
- Expansion Revenue Rate – revenue growth from existing customers above the prior-period baseline
- Contraction Revenue Rate – revenue decline from existing customers still active but spending less
- New Customer Revenue % – the share of current-period revenue attributable to newly acquired accounts
Outputs include a Statistics Sheet with period-level aggregates, a Detail Sheet with account-level classification across every period, waterfall visualizations, and a Configuration Sheet. The tool supports both monthly and annual views, LTM and YTD period selections, units as well as revenue, and filtering by any non-required column including product, region, parent account, or other segmentation variables in the source file.
Two configuration parameters underpin the entire classification system and are adjustable instantly: the inactivity window and the minimum activity threshold.
The inactivity window defines how many consecutive zero-revenue periods must pass before an account moves from Inactive to Lost. This number is not universal. An HVAC customer who goes eight months without a service call may be completely normal given seasonal buying patterns. A SaaS customer who goes two months without a subscription payment is almost certainly churned. Setting the wrong inactivity window misclassifies accounts at scale and distorts every downstream metric — NRR, CRR, churn rate, and lifetime value all shift depending on where this line is drawn.
The minimum activity threshold defines the floor below which a transaction does not count as active. A single small purchase that resets an otherwise-dormant account into Retained can significantly overstate true customer persistence. The threshold ensures that only meaningful activity registers as retention.
For analysts doing this work manually in Excel, adjusting either parameter requires rebuilding the classification logic across the entire dataset — often a multi-hour process that makes scenario testing impractical. In the Retention Analysis Tool, both parameters are set in the configuration and applied instantly across every account and every period in the dataset. Changing the inactivity window from six months to nine months, or adjusting the minimum threshold, recalculates the full output in seconds.
Why Configuration Flexibility Changes the Analysis
For a private equity analyst or associate running diligence on a target company, the configuration parameters are not a minor feature. They are the difference between analysis that reflects economic reality and analysis that does not.
Consider a business with net 30 payment terms and a customer base that occasionally runs 60 or 90 days late before settling in full. A standard cohort model with a 30-day inactivity window classifies those customers as Lost — then flags them as Returning when payment arrives. The retention metrics look volatile. Churn appears elevated. NRR is understated. None of it reflects the actual customer relationship. Set the inactivity window to 90 days, and the same dataset produces a materially different picture: stable retention, lower churn, and a base that is behaving exactly as the business model would predict.
The same logic applies to minimum transaction thresholds. If the target’s average contract value is $2,000 and a customer posts a $10 charge in a given period, that is not retention — it is a billing artifact. Without a minimum activity threshold, that account registers as Retained and carries full weight in CRR and NRR calculations. Set the threshold at $1,000 and the noise disappears. The metrics reflect only customers who are actually buying at scale.
Parent and subsidiary structures introduce a third layer of complexity that blended reporting cannot handle cleanly. A private equity analyst evaluating a B2B business needs to know whether a Fortune 500 customer is growing or contracting at the enterprise level — not whether individual locations are cycling in and out of the dataset. The Retention Analysis Tool supports parent-level aggregation alongside subsidiary or location-level detail, so the analyst can run both views without rebuilding the model.
What makes this consequential in a diligence context is not just the accuracy — it is the speed. Adjusting any of these parameters in a custom Excel model means rewriting classification logic across every account and every period. That is a multi-hour rebuild, often per scenario. In the Retention Analysis Tool, changing the inactivity window, the minimum threshold, or the parent-subsidiary grouping takes seconds and instantly recalculates the full output. An analyst can run five parameter scenarios in the time it would previously take to run one. For a deal team working under timeline pressure, that is a meaningful operational advantage.
Why This Matters in Private Equity
Private equity firms model entry assumptions around customer economics. Revenue projections, churn-adjusted EBITDA, valuation assumptions, and long-term margin expectations all depend on how long customers stay and what they spend over time. Customer retention is ultimately a proxy for the quality and durability of a company’s cash flows, which sits at the center of every private equity valuation and return model. Most of those assumptions are derived from blended averages that have not been stress-tested at the account level.
A CIM with a strong NRR figure tells you the outcome. It does not tell you the structure underneath it.
Retention also validates whether customer acquisition economics actually work. A business can report strong topline growth while quietly losing customers underneath the surface. New customer acquisition can temporarily mask churn, but it cannot eliminate it.
Two businesses can report identical NRR metrics with fundamentally different customer books. One may be generating durable expansion revenue from existing accounts. Another may be offsetting elevated churn with aggressive new customer acquisition that becomes difficult to sustain as acquisition costs rise.
The Retention Analysis Tool separates those conditions directly. By classifying every account into lifecycle states across every period, the platform reveals whether retention is being driven by existing customer persistence or by constant replacement through new customer acquisition. It also identifies whether deterioration is concentrated within a particular product line, geography, or acquisition channel.
That visibility matters before acquisition, after close, and during exit preparation when buyers begin validating the durability of the underlying customer base. Deteriorating retention discovered during sell-side diligence is often a valuation haircut. Strong retention trends are easier to defend because they support the durability of future cash flows.
Industry benchmarks provide the reference frame. In B2B SaaS, Net Dollar Retention above 110% is often considered best-in-class because expansion revenue more than offsets churn and contraction. Businesses with stronger retention profiles consistently command higher valuation multiples than businesses with similar topline growth but weaker customer persistence. The benchmarks vary by industry, but the principle remains consistent: retention quality is a direct input into valuation, and the Retention Analysis Tool produces the account-level data needed to measure it.
For portfolio companies, the platform also creates a measurable operational baseline. NRR, CRR, churn, expansion, and contraction metrics become benchmarks against which future operational changes can be measured. Changes to onboarding, pricing, service delivery, customer support, or sales process often influence customer behavior over multiple periods before blended reporting surfaces the impact clearly. By tracking lifecycle classifications continuously, the Retention Analysis Tool surfaces those changes earlier.
For firms operating multiple portfolio companies, the platform also enables consistent retention benchmarking across the portfolio. Which businesses are generating the strongest expansion revenue from existing accounts? Which are relying most heavily on new customer acquisition to sustain topline growth? Which markets are showing early deterioration in customer persistence? Those questions are difficult to answer from blended monthly reporting alone. They become measurable when account-level retention is classified consistently across the portfolio.
Industry Applications
The Retention Analysis Tool is not industry-specific. It applies anywhere structured account-level revenue or unit data exists.
In automotive dealership groups, the platform supports same-store analysis, dealership benchmarking, and customer persistence tracking across dealer groups. Account-level classification helps identify which rooftops are expanding existing customer relationships versus relying primarily on new acquisition to sustain revenue growth.
In HVAC and field service rollups, customer persistence directly influences long-term profitability. HVAC is one of the most active rollup categories in private equity heading into 2026 — fragmented regional operators with service calls in the $100 to $500 range and installations in the $8,000 to $15,000 range are being consolidated at pace by both strategic acquirers and financial sponsors. A retained customer generates recurring maintenance, repair work, and eventual system replacement revenue. A lost customer represents that future revenue transferred to a competitor. The Retention Analysis Tool supports both unit and revenue analysis, allowing firms to track service calls, installations, maintenance agreements, and customer expansion across acquired operators while identifying which markets are experiencing weakening persistence after acquisition.
In software and subscription businesses, the platform decomposes NRR into expansion, contraction, retention, and churn dynamics at the account level. Two businesses can report similar NRR figures while having very different underlying customer behavior. The Retention Analysis Tool surfaces that structure directly.
The same framework also applies to recurring service businesses, membership organizations, specialty retail, and multi-location operators where repeat customer behavior materially affects long-term economics.
What the Output Includes
The Retention Analysis Tool generates four primary outputs:
- A Statistics Sheet with period-level aggregates for NRR, CRR, churn, expansion, contraction, and new customer contribution across monthly, annual, LTM, and YTD periods
- A Detail Sheet with account-level lifecycle classification across every period in the dataset
- Waterfall Visualizations showing movement between retained, expanded, contracted, returning, and lost states across periods
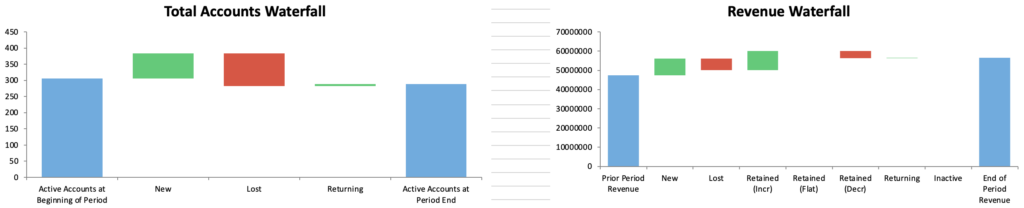
- A Configuration Sheet documenting the parameters used to generate the analysis for reproducibility and internal reporting
The result is a structured view of how a customer base is actually behaving beneath the topline numbers.
Blended revenue reporting tells you what a business produced during a given period. It does not tell you whether the underlying customer base is expanding, stabilizing, or quietly deteriorating beneath the surface.
The Retention Analysis Tool makes those dynamics visible: account by account, period by period, segmented by the variables that matter.
That is the view private equity needs in diligence. It is the baseline operators need post-acquisition. It is the evidence that supports a premium exit.