
When it’s time to sell your company, everything gets scrutinized. Especially the numbers. For F&I administrators, few metrics carry more weight with buyers than the loss ratio—and yet that number is only as accurate as the earnings curve behind it. If your curve is wrong, your loss ratios are wrong. And if your loss ratios […]
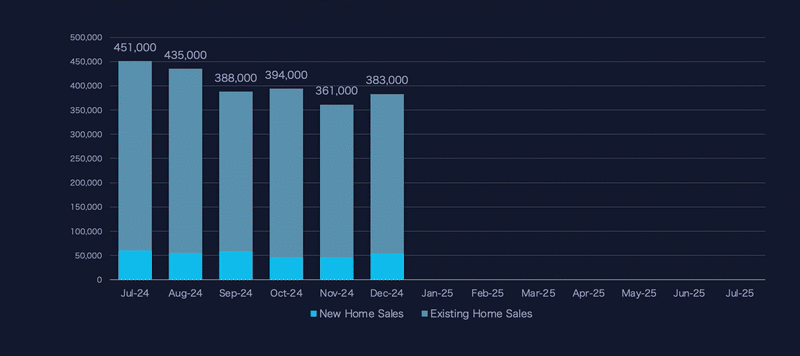
The housing market isn’t crashing—but it is shifting. Slowly. Unevenly. And for home warranty providers, July 2025 offers critical signals about where demand is likely to rise, where lead quality is improving, and where to allocate marketing and service resources next. While national home sales totals held steady compared to June, the underlying details show […]
If you’re relying on cancellation curves from your payment plan provider—like PayLink, Mepco, or Walco—you’re only seeing part of the story. Those blended curves are useful for tracking total portfolio performance. But they won’t tell you why cancellations are happening. Because they don’t show you the differences that matter. The only way to do that? […]
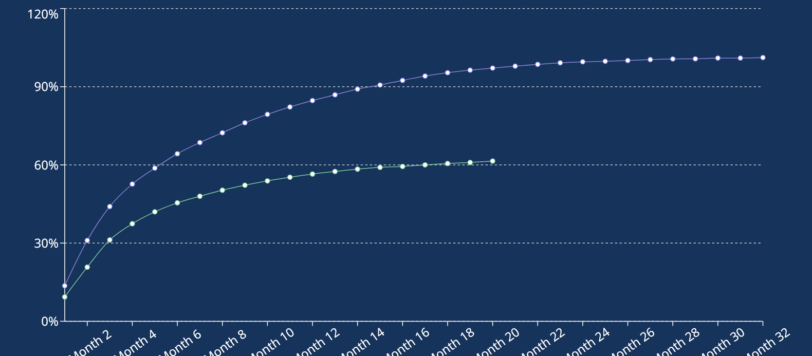
If you’re only looking at your overall cancellation rate, you’re missing the real story. Cancellation behavior isn’t static. It shifts over time—and across different groups of contracts. That’s why you need to break it down by vintage. “A vintage is a group of contracts that started in the same period—typically a month, quarter, or year. […]
When preparing a company for sale, financial optics matter. For F&I administrators, few metrics carry more weight with buyers than loss ratios—and those ratios are only as accurate as the earnings curve behind them. F&I earnings curve optimization must happen before a company goes up for sale. Here’s a real-world example of how defaulting to […]
In June 2025, the U.S. housing market showed signs of quiet recalibration. Total home sales slipped slightly to 445,000 units—down just 1,000 from May. But beneath that national flatline, regional and state-level shifts reveal a more dynamic story. New home sales nudged downward, while existing home sales essentially held their ground. Inventory rose. Buyer activity […]
If you’re administering Vehicle Service Contracts, VSC cancellations aren’t just noise—they’re a direct hit to profitability. Refund exposure. Margin compression. Loss ratio volatility. Whether contracts are sold direct-to-consumer or through dealerships, VSC cancellations are a real and rising cost. And yet, most administrators aren’t actively tracking how, when, and where these VSC cancellations are happening. […]
Home sales in May 2025 reflected a market at a crossroads—nudging upward in some areas while falling back in others. On the surface, total U.S. home sales climbed to 446,000 units, up from 414,000 in April. That 7.7% month-over-month bump sounds like momentum. But look closer, and the picture’s more complex. Behind the headline numbers […]
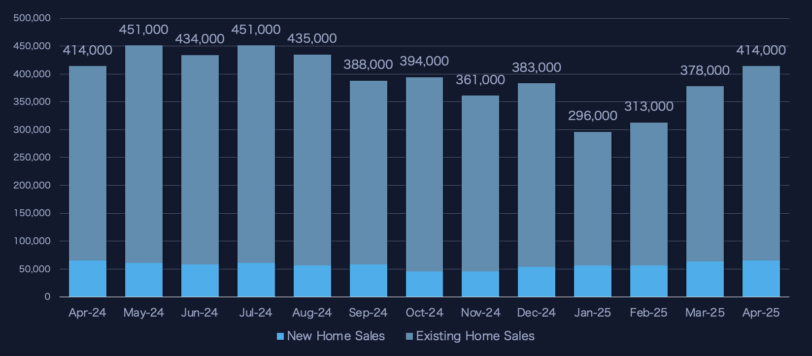
Home sales climbed in April—but momentum is still hard to come by. New construction helped lift total volume, while existing home sales ticked up seasonally. Yet under the surface, familiar constraints continue to shape the market: high mortgage rates, weak affordability, and a growing disconnect between buyers and sellers. Across both segments, inventory is rising. […]
Home sales across the U.S. jumped in March 2025, signaling a typical spring bounce in buyer activity—but that momentum was layered atop a still-fragile foundation. Compared to February, total home sales rose by more than 20%, with gains across both new and existing home categories. However, viewed in the broader context of persistent affordability issues, […]