
What’s a Cancellation Curve—And What Can It Tell Me That a Simple Cancellation Rate Can’t?
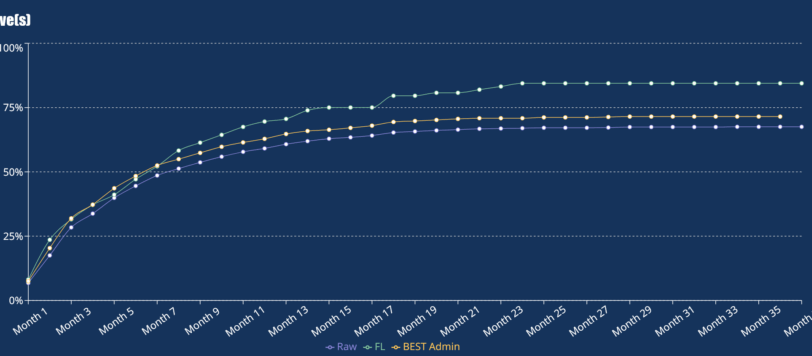

If you’re a VSC or home warranty marketer, tracking cancellations isn’t optional. But if you’re still relying on a single cancellation rate number, you’re missing the full story—and leaving money on the table.
A cancellation rate tells you how many customers cancel. A Cancellation Curve shows when they cancel—and the timing of those cancellations often has a greater impact on profitability than the overall cancellation rate alone.
What is a cancellation curve?
A Cancellation Curve is a time-aligned visualization of cumulative cancellations over the life of a contract. By aligning every contract to Month 1, it shows when cancellations occur and makes it possible to compare cancellation behavior across different customer cohorts, products, marketers, and sales strategies.
At Dark Sky Data, our Cancellation Curves analytics tool helps you visualize how cancellations develop over the life of a contract, making it easy to compare customer behavior across products, campaigns, lead sources, payment terms, and other segments.
Instead of just saying “50% of contracts cancel,” a cancellation curve shows whether:
- 25% canceled by Month 2 (a big red flag), or
- Cancels trickled in gradually over 18 months (much healthier)
That difference has massive implications for cash flow, reserves, marketing payback, and sales strategy.
Why isn’t a simple cancel rate enough?
Let’s say you and a competitor both have a 53% cancel rate. Sounds similar, right?
But your curve shows most cancels happen in Months 1–3. Theirs cancel between Months 12–18.
That means:
- You’re burning marketing dollars without seeing cash
- You have higher refund exposure
- Your finance company holds more in reserves
Same rate. Very different risk profile.
Only the curve reveals that difference.
What can I learn from a cancellation curve?
Once you see the shape of your curve, you can diagnose where the problem is—and act on it.
- Steep early slope? Your customers are quitting fast—check your down payments, reps, and payment terms
- Flat curve after Month 3? Your stickiness is strong—use that to negotiate lower reserves
- Sudden drop at a specific month? Something may be triggering cancels (payment bumps, coverage confusion, service failures)
You can also segment your curves by:
- Sales rep
- Down payment
- Lead source
- Monthly payment
- Finance term
- Vintage
- State
And that’s where the real insights—and savings—start.
Bottom line: Curves unlock control
A topline cancellation rate is just a scoreboard.
A cancellation curve is a playbook.
It tells you when risk shows up, why it happens, and how to get ahead of it—whether you’re adjusting your sales comp, reworking offer structures, or negotiating with your finance partner.
You don’t need analysts or dashboards to get there.
You just need the right tool.
📉 Explore Dark Sky Data’s Cancellation Curves