Blog

Sep 2

July 2025 Home Sales: What Home Warranty Providers Need to Know

The housing market isn’t crashing—but it is shifting. Slowly. Unevenly. And for home warranty providers, July 2025 offers critical signals about where demand is likely to rise, where lead quality is improving, and where to allocate marketing and service resources next. While national home sales totals held steady compared to June, the underlying details show […]

Aug 8

The Most Important Metrics for VSC and Home Warranty Marketers

You Can’t Afford to Guess Most direct-to-consumer marketers in the vehicle service contract (VSC) and home warranty space know their topline numbers. Sales volume. Cancel rate. Cost per lead. But those numbers don’t tell you what’s really happening. They don’t show you which reps are killing margin, which campaigns are quietly failing, or where your […]

Aug 7

The Quiet Leak in Your Funnel: Resold Leads and Lost Contracts

What a spike in your Cancellation Curves is trying to tell you. Most cancellation curves follow a predictable shape: a small bump in early months, then a slow, steady climb. That’s the norm. But if you’re seeing a sudden spike in Month 3, something is off—and it’s probably not your product. For VSC and home […]

Aug 4

What’s a Cancellation Curve—And What Can It Tell Me That a Simple Cancellation Rate Can’t?

If you’re a VSC or home warranty marketer, tracking cancellations isn’t optional. But if you’re still relying on a single cancellation rate number, you’re missing the full story—and leaving money on the table. A cancellation rate tells you how many customers cancel. A Cancellation Curve shows when they cancel—and the timing of those cancellations often […]

Jul 30

Cancellation Curves: What Slope Tells You That Totals Can’t

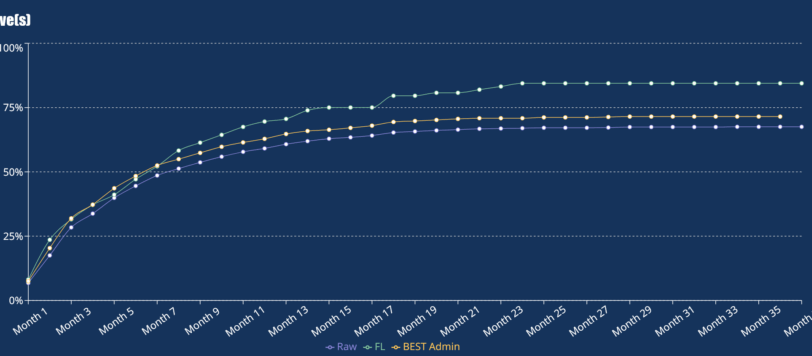
At high rate of early cancellation can fundamentally alter the shape of the graph.

In a Cancellation Curve, the trajectory of cancellations matters more than the final number. For VSC and home warranty marketers, the timing of cancellations drives profitability. Early cancels destroy cash flow—so don’t just track how many. Track when. Why do early cancellations hurt more? If you’re a VSC marketer or home warranty marketer, you know […]

Jul 28

How to Get Your Finance Company to Lower Your Reserve Rate

When you’re scaling direct-to-consumer sales in the Vehicle Service Contract (VSC) or home warranty space, cash flow is king. You launch a $100,000 campaign. You pay your mail house and lead vendor on June 1. The mail hits mailboxes on June 10. Responses trickle in through early July. You close sales—but then wait 45 days […]

Jul 24

Why Blended Cancellation Curves Are Misleading

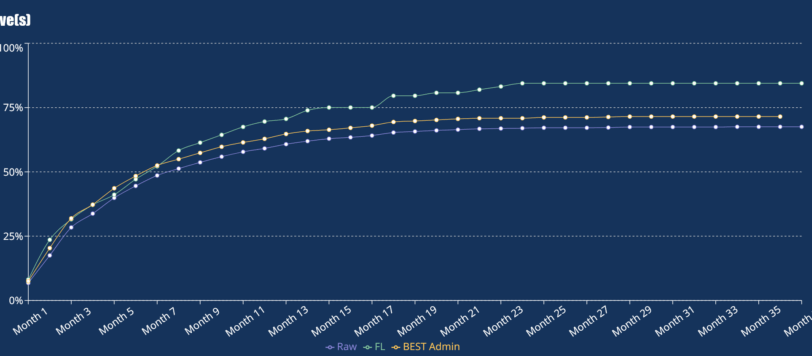
If you’re relying on cancellation curves from your payment plan provider—like PayLink, Mepco, or Walco—you’re only seeing part of the story. Those blended curves are useful for tracking total portfolio performance. But they won’t tell you why cancellations are happening. Because they don’t show you the differences that matter. The only way to do that? […]

Jul 22

Why Vintage Analysis Matters in Understanding Cancellations

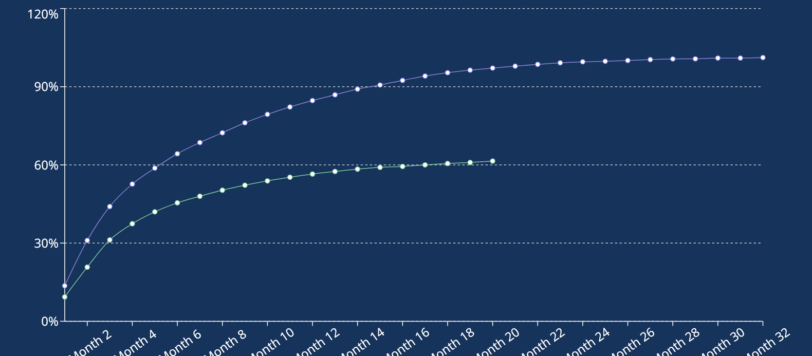
Two curves, representing different vintages, generated by the Dark Sky Data Experience Curve.

If you’re only looking at your overall cancellation rate, you’re missing the real story. Cancellation behavior isn’t static. It shifts over time—and across different groups of contracts. That’s why you need to break it down by vintage. “A vintage is a group of contracts that started in the same period—typically a month, quarter, or year. […]

Jul 18

How the Wrong Earnings Curve Almost Cost an F&I Administrator Millions

When preparing a company for sale, financial optics matter. For F&I administrators, few metrics carry more weight with buyers than loss ratios—and those ratios are only as accurate as the earnings curve behind them. F&I earnings curve optimization must happen before a company goes up for sale. Here’s a real-world example of how defaulting to […]

Jul 17

Home Sales in June 2025: State-Level Shifts Amid a Rebalancing Market

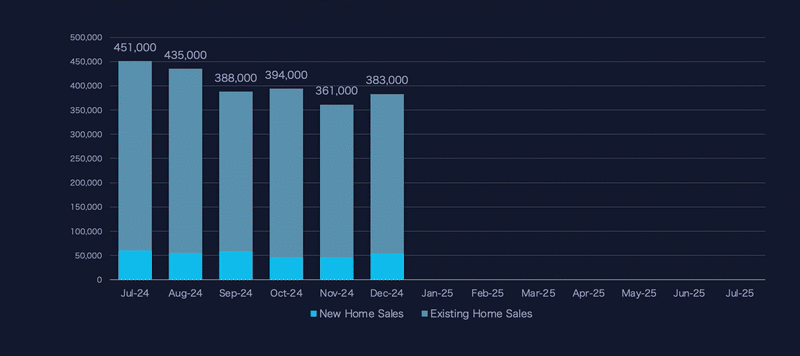
In June 2025, the U.S. housing market showed signs of quiet recalibration. Total home sales slipped slightly to 445,000 units—down just 1,000 from May. But beneath that national flatline, regional and state-level shifts reveal a more dynamic story. New home sales nudged downward, while existing home sales essentially held their ground. Inventory rose. Buyer activity […]