
Customer Retention Metrics: Beyond the Headline Numbers
The most dangerous number in a Confidential Information Memorandum (CIM) is a topline revenue figure that is growing while the underlying customer base is quietly deteriorating.
Customer retention is ultimately a proxy for the quality and durability of future cash flows. Businesses that consistently retain customers produce more predictable revenue, require less acquisition spend to sustain growth, and generally command stronger valuations than businesses producing similar growth while constantly replacing lost customers.
New customer acquisition can mask churn for twelve, eighteen, or twenty-four months before the effect appears in aggregate financial reporting. By the time the deterioration is visible in the numbers a buyer sees during diligence, it has already been compounding. Blended retention metrics—the kind reported in most management packages—make this possible by averaging durable and fragile customer behavior into a single figure that can appear stable while the composition underneath it shifts.
Cohort-based retention analysis forces that composition into view. Rather than describing only the outcome, it explains the customer behavior that produced it. The metrics below are what a properly structured retention analysis generates. Each one answers a question that aggregate reporting cannot.
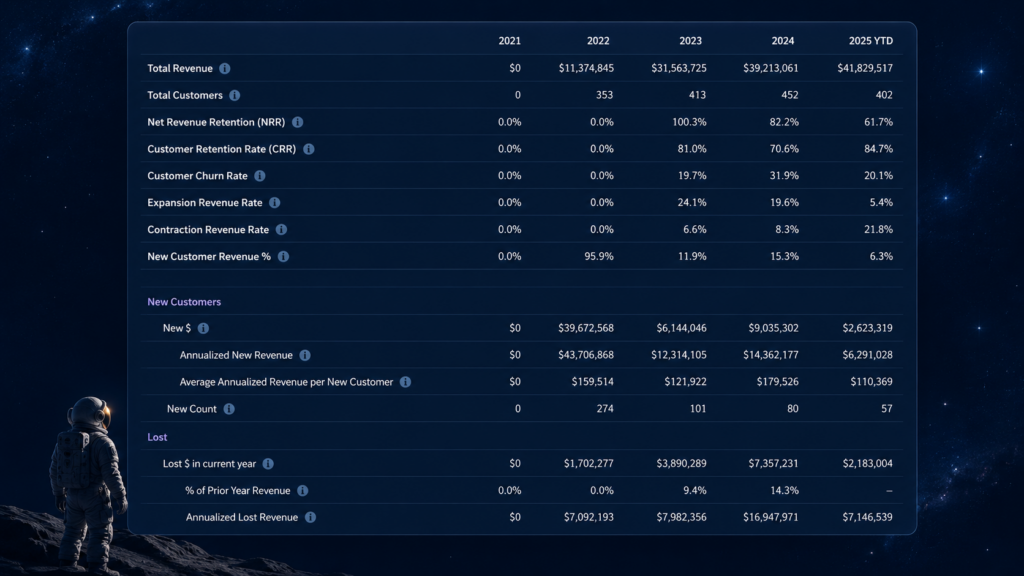
Figure 1. A retention analysis combines headline metrics with customer-level classifications to explain not only what happened, but why it happened.
Net Revenue Retention (NRR)
Formula: Revenue from prior-period customers in the current period ÷ Total prior-period revenue.
Net Revenue Retention (NRR) measures whether existing customers generate more or less revenue over time without relying on new customer acquisition.
Above 100%, the installed customer base compounds. A business with 110% NRR could stop acquiring new customers entirely and still grow revenue year over year from the accounts already on its books. That is the economic dynamic that commands premium valuation multiples in recurring revenue businesses. Buyers are purchasing a compounding asset, not a treadmill.
Below 100%, the installed base is eroding. Every percentage point below 100% represents prior-period revenue that must be replaced before the business can generate any net growth. At 90% NRR, the company loses ten cents of every existing revenue dollar annually. Acquisition must first replace that erosion before it contributes to growth. The topline may continue to increase while the underlying customer base steadily weakens.
The limitation of NRR as a standalone metric is that it says nothing about why the result occurred. An NRR of 95% can be produced by several different combinations of churn, expansion, and contraction, each carrying very different operating and valuation implications. NRR describes the outcome. The remaining metrics explain the composition that produced it.
Traditional retention reporting often stops here. NRR is an excellent headline metric because it summarizes how the installed customer base performed financially, but it does not explain the customer behavior underneath the number. That explanation comes from separating customers into behavioral states—those who expanded, remained flat, contracted, churned, returned, or were newly acquired. Those distinctions reveal whether the business is strengthening beneath the surface or simply maintaining growth through continual replacement.
Benchmark: Above 110% is generally considered best-in-class for recurring revenue businesses. Between 100% and 110% is healthy. Below 100% typically requires an explanation grounded in customer-level analysis.
Customer Retention Rate (CRR)
Formula: Customers retained from prior period ÷ Customers at the start of the prior period.
Customer Retention Rate (CRR) measures customer persistence independently of revenue. Unlike NRR, it treats every customer equally regardless of account size.
High CRR with NRR below 100% suggests customers are remaining with the business while reducing their spending. The relationship persists, but wallet share contracts. That points toward different operational issues than outright churn. Pricing may be weakening, product engagement may be declining, or the customer segment itself may be under pressure.
The opposite scenario carries a different risk. A business with rising NRR but declining CRR may be relying on a relatively small group of expanding customers to offset a broader pattern of customer attrition. Revenue appears healthy while concentration risk quietly increases.
For businesses with relatively consistent customer value—subscription businesses, recurring service providers, warranty administrators, or dealership relationships—CRR is often one of the most operationally honest measures of customer health because it cannot be materially inflated by the growth of a handful of large accounts.
Benchmark: Annual CRR between 80% and 90% is generally considered healthy for many recurring service businesses. Higher retention is expected where customer relationships are deeply embedded and switching costs are significant.
Customer Churn Rate
Formula: 1 − Customer Retention Rate.
Customer churn is simply the inverse of retention, but its financial implications compound over time.
An annual churn rate that appears manageable in a single reporting period can materially reshape the customer base across an investment horizon. At 8% annual churn, a business replaces roughly one-quarter of its customers over a three-year holding period simply to maintain its existing customer count. At 12% annual churn, it replaces more than one-third. The difference between 8% and 12% may appear small when viewed as annual percentages. Across a five-year hold, however, it represents the difference between a business that compounds customer relationships and one that continually rebuilds them.
For investors, the question is not whether churn is acceptable in isolation. The question is whether the cost of replacing churned customers has been fully incorporated into the operating model. Customer acquisition costs are frequently projected forward while implicitly assuming a stable installed base. If customer attrition is higher than expected, acquisition spending increasingly shifts from funding growth to replacing lost customers. That dynamic quietly erodes capital efficiency long before it becomes obvious in reported financial performance.
Additional Diagnostic: Expansion Revenue
Formula: Revenue from Retained (Incr) customers ÷ Total prior-period revenue.
Expansion revenue measures how much growth is generated by customers who remained with the business and increased their spending. Unlike new customer acquisition, this growth comes entirely from the installed customer base.
Expansion is one of the clearest indicators of customer health because it reflects customers choosing to deepen their relationship with the business. That may result from broader product adoption, increased usage, pricing power, or higher wallet share. Regardless of the driver, expansion demonstrates that customers are finding additional value after the initial sale.
Strong expansion revenue can offset meaningful churn and keep NRR above 100%. At the headline level, that may appear attractive. The diligence question is whether expansion is broadly distributed across the customer base or concentrated among a relatively small number of accounts. Those two scenarios carry very different implications for future cash flows. Broad-based expansion suggests durable customer economics. Concentrated expansion may indicate increasing customer concentration risk that is hidden inside an otherwise healthy NRR.
Traditional retention metrics summarize the outcome. Expansion revenue helps explain where that outcome originated.
Additional Diagnostic: Revenue Contraction
Formula: Revenue lost from Retained (Decr) customers ÷ Total prior-period revenue.
Revenue contraction isolates customers who remain active but have reduced their spending. These customers are often invisible in traditional retention reporting because they are still classified as retained. They remain in customer counts and do not appear in churn statistics, yet the revenue erosion has already occurred.
For many businesses, contraction is one of the earliest observable indicators that future retention may weaken. Customers frequently reduce spending before ending the relationship altogether. When that sequence occurs, revenue is affected twice: first through contraction and later through churn.
Separating contraction from overall retention allows analysts to distinguish customers who are stable from customers who are beginning to disengage. A meaningful Retained (Decr) cohort should prompt additional questions during diligence. Is spending declining across a broad segment? Is pricing under pressure? Are customers migrating to lower-value products? Those answers rarely appear in summary retention tables but become visible when customer behavior is classified at the account level.
New Customer Revenue %
Formula: New customer revenue ÷ Total revenue.
New Customer Revenue measures how much of current revenue comes from customers acquired during the reporting period. By itself, the metric is neither positive nor negative. Its interpretation depends entirely on the retention context surrounding it.
High NRR combined with meaningful new customer revenue suggests a business that is simultaneously retaining existing customers and expanding through new acquisition. That is typically a healthy growth profile.
High new customer revenue paired with weakening NRR tells a different story. Acquisition may be compensating for deterioration within the installed customer base rather than building upon it. Revenue continues to grow, but the composition of that growth changes in important ways.
For private equity, that distinction matters because customer acquisition can temporarily mask underlying weakness during a holding period. A business growing rapidly through new customer acquisition may look attractive today, but whether those newly acquired cohorts retain as successfully as historical cohorts cannot be determined from blended reporting alone. That question requires customer-level cohort analysis across multiple periods.
The Classification Framework
Every metric above is ultimately derived from a classification applied to every customer account during every reporting period.
The Retention Analysis Tool assigns each account to one of seven behavioral states:
- New — First qualifying purchase in the dataset with no prior-period activity above the defined threshold.
- Retained (Incr) — Active in both periods with spending meaningfully above the prior-period baseline. Drives expansion revenue.
- Retained (Flat) — Active in both periods with spending remaining within the defined flat threshold.
- Retained (Decr) — Active in both periods with spending meaningfully below the prior-period baseline. Drives revenue contraction.
- Lost — Previously active but no qualifying activity within the configured inactivity window. Classified as churned.
- Returning — Previously classified as Lost but has resumed qualifying activity during the current period. Measures customer reactivation and win-back effectiveness.
- Inactive — Present within the dataset but below the minimum activity threshold. Excluded from retention calculations to prevent administrative or immaterial transactions from distorting the analysis.
These classifications transform retention metrics from descriptive ratios into an explanation of customer behavior.
When NRR and CRR diverge, the Retained (Decr) cohort frequently explains the difference. When NRR remains above 100% despite meaningful customer attrition, the Retained (Incr) cohort often explains the offset. Rather than asking only whether retention improved or deteriorated, analysts can identify precisely which customer behaviors produced the result.
That is the distinction between reporting retention and understanding it.
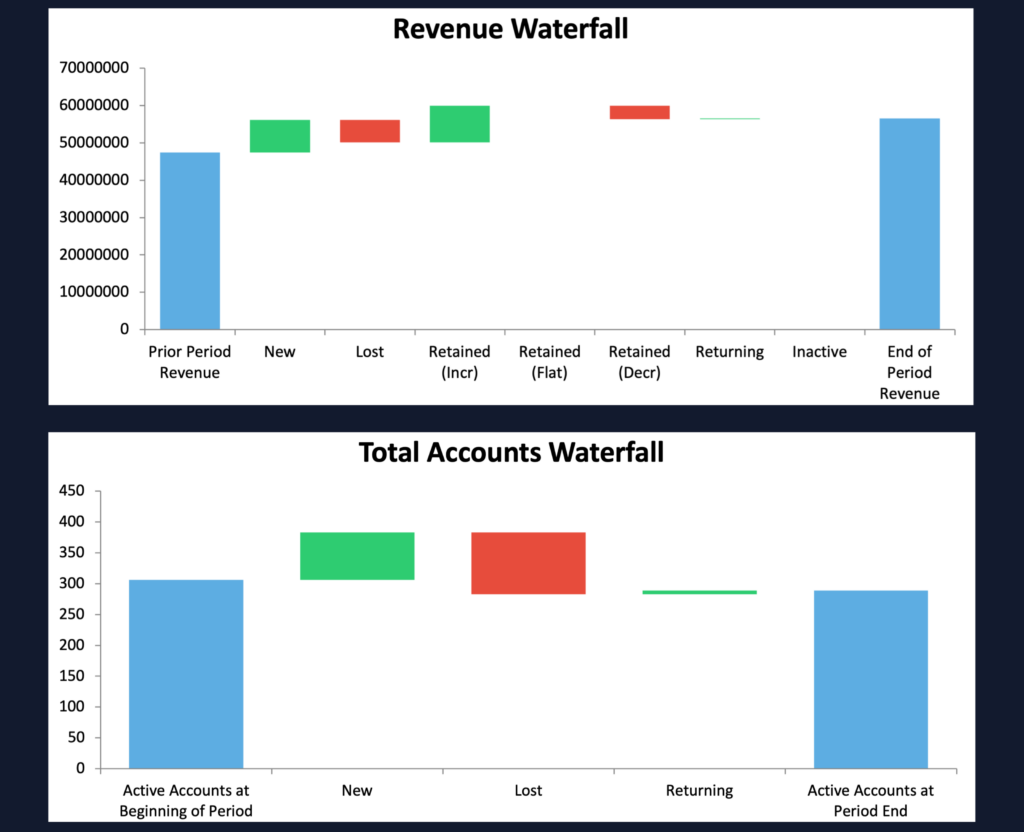
Figure 2. Revenue and account waterfalls show how individual customer classifications combine to produce overall retention outcomes. Rather than viewing only beginning and ending totals, analysts can isolate the specific customer behaviors driving changes in revenue and account counts.
Why Classification Parameters Determine Metric Quality
Every retention metric is only as reliable as the assumptions used to classify customer activity. Two parameters determine that classification.
The inactivity window defines how many consecutive reporting periods without qualifying activity must pass before a customer is classified as Lost. If the window is too short, seasonal or infrequent customers are prematurely classified as churned. Retention becomes understated while churn becomes overstated. If the window is too long, customers with little realistic chance of returning continue to be counted as retained. Retention becomes overstated while churn appears artificially low.
The minimum activity threshold determines how much revenue is required before activity is considered meaningful. Without an appropriate threshold, refunds, administrative adjustments, or insignificant transactions may incorrectly classify dormant customers as active. Setting a meaningful threshold ensures that only genuine customer activity influences retention calculations.
Neither parameter has a universal value. An HVAC service customer has very different purchasing behavior than a SaaS subscriber. A warranty customer behaves differently than a recurring B2B software account. The correct methodology depends on the economics and buying cycle of the business being analyzed.
The Retention Analysis Tool allows both parameters to be adjusted in real time, with classifications, metrics, and waterfall analyses recalculating instantly. Analysts can test assumptions, evaluate sensitivity, and defend the methodology supporting every reported metric.
That transparency matters because retention figures without clearly defined classification logic can mean almost anything. A business reporting 90% annual retention may be using a methodology that counts any customer generating any amount of revenue during the year—even a single administrative transaction. That is fundamentally different from measuring retention using explicit activity thresholds and consistent customer classifications.
Making those assumptions visible transforms retention analysis from a reporting exercise into a defensible analytical framework.
What the Full Picture Reveals
No single retention metric can fully describe the health of a customer base.
Net Revenue Retention tells you whether existing customers are generating more or less revenue over time. Customer Retention Rate tells you how many customers stayed. Customer Churn Rate measures the pace at which the business must replace lost customers simply to maintain its existing base. Expansion Revenue identifies where retained customers are deepening their relationship with the business, while Revenue Contraction identifies customers who remain active but are already reducing their spend—often before they ultimately churn. New Customer Revenue reveals how much of current growth depends on acquiring new customers rather than expanding the installed base.
Each metric answers a different question. Together, they provide a far more complete picture of customer persistence than any blended retention statistic can provide on its own.
The real insight, however, comes from understanding the customer behavior that produced those metrics.
Classification transforms retention reporting from descriptive to diagnostic. Rather than simply knowing that NRR declined or churn increased, analysts can identify whether the change resulted from widespread customer contraction, concentrated account losses, weaker expansion, slowing acquisition, or shifts in customer reactivation. Those are fundamentally different operating problems, even if they produce similar headline metrics.
That distinction matters throughout the investment lifecycle. During diligence, it helps buyers evaluate the durability of future cash flows instead of relying solely on historical financial performance. In portfolio ownership, it helps management teams identify changes in customer behavior before they appear in topline reporting. At exit, it provides a defensible explanation for how customer quality has evolved over the holding period.
Ultimately, that is what private equity is trying to measure—not simply whether retention appears acceptable, but whether the underlying customer base is becoming stronger or weaker over time.
The Retention Analysis Tool was built around that objective. By classifying every account into consistent behavioral states—New, Retained (Incr), Retained (Flat), Retained (Decr), Lost, Returning, and Inactive—it reveals the composition behind the headline metrics and gives investors, operators, and advisors a clearer understanding of the customer dynamics driving business performance.
Explore the Retention Analysis Tool
Traditional retention reporting tells you what happened.
The Retention Analysis Tool shows you why.
Using configurable classification logic, customizable inactivity windows, and account-level behavioral analysis, it transforms raw customer transaction data into actionable retention intelligence for private equity firms, recurring revenue businesses, warranty administrators, dealerships, and other organizations where customer persistence drives long-term value.