
September 2026 New Home Sales: Steady Volume, Median Climbs Back Above $400K
Based on the U.S. Census Bureau and HUD September 2026 release, issued October 27, 2026
September 2026 new home sales came in at a seasonally adjusted annual rate of 676,000 — essentially flat with a revised August reading of 680,000 and the third consecutive month in the 647,000–680,000 range. The month-over-month change of -0.6% is well within the standard confidence interval of the survey and carries no statistical significance. What September delivered instead was consistency: the new home market has now held in a relatively tight band for four months running, with June, August, and September all printing between 676,000 and 680,000 SAAR on their most current revised figures.
The pricing story is more layered. The September median came in at $400,400 — up 3.9% from August and back above $400,000 for the first time since June. But the comparison that matters most is also the most surprising: the August median was revised sharply downward, from $393,700 (as reported in our prior analysis) to $385,400. The reported increase to $400,400 is measured from a lower revised base than preliminary figures suggested, but the month-to-month change is not statistically significant. Whether September’s reading reflects a genuine floor firming or is partly a product of normal monthly mix variation is the question the next two releases will answer.
The year-to-date deficit through September held at -2.9% — exactly where it stood through August. Not widening. That is the market in a sentence: same pace, same gap, same fundamental picture.
Key Takeaways
- September 2026 new home sales held at a 676,000 SAAR — essentially flat with a revised August and the third month in a row at this level, marking the longest sustained plateau of the year.
- The median sales price climbed to $400,400 — back above $400,000 for the first time since June — though the August median was revised significantly downward to $385,400, making the MoM swing larger than expected.
- The YTD deficit held at -2.9% through September, unchanged from August, as volume trends continue to track near — but not yet at — 2025’s pace.
September 2026 New Home Sales at a Glance
| Metric | September 2026 (p) | August 2026 (r) | September 2025 |
|---|---|---|---|
| SAAR | 676,000 | 680,000 | 714,000 |
| Homes Sold (NSA) | 56,000 | 57,000 | 58,000 |
| Homes For Sale (SA) | 476,000 | 481,000 | 487,000 |
| Months’ Supply | 8.4 | 8.5 | 8.2 |
| Median Sales Price | $400,400 | $385,400 | $416,800 |
On an unadjusted basis, 56,000 new homes were sold in September — modestly below the revised August figure of 57,000 and the September 2025 reading of 58,000. A deficit of 2,000 units against a year earlier is consistent with the YTD picture, although August’s unadjusted sales matched the year-earlier estimate. The seasonal pattern for October and November will determine whether the full-year deficit closes further or holds near its current level.
Revisions Reshape the Summer Sales Pattern
Revisions continued to reshape the 2026 trajectory. June and July were adjusted upward again, while August was revised modestly lower. The most notable revision is to the August median sales price, which dropped to $385,400 from the preliminary $393,700 — a meaningful downward adjustment of $8,300 that changes how September’s $400,400 reads in context.
| Month | SAAR | Notes |
|---|---|---|
| January 2026 | 576,000 | Revised |
| February 2026 | 630,000 | Revised |
| March 2026 | 659,000 | Revised |
| April 2026 | 641,000 | Revised |
| May 2026 | 636,000 | Revised |
| June 2026 | 680,000 | Revised up from 672,000 |
| July 2026 | 647,000 | Revised up from 643,000 |
| August 2026 | 680,000 | Revised down from 684,000 |
| September 2026 | 676,000 | Preliminary |
June’s SAAR was revised upward again — this time from 672,000 to 680,000 — which means June, August, and September now all share essentially the same SAAR level. July’s modest upward revision (643,000 to 647,000) preserves it as the soft point of the recent arc, but a gap of only 33,000 units from the surrounding months is not the kind of deterioration that alters the trend story.
On an unadjusted basis, the year-to-date total through September 2026 stands at 506,000, down 2.9% from 521,000 through the same period in 2025. The gap has not moved in two consecutive months — a signal that the current run rate is closely tracking the 2025 pace.
Regional Picture: West Posts First Sequential Recovery, South Softens
The West was the unexpected headline in September. After falling to 117,000 SAAR in August (revised), the region rebounded to 142,000 SAAR in September — a 21.4% month-over-month gain. On a year-over-year basis, the West remains 17.4% below September 2025’s 172,000 SAAR, and the confidence interval on a single-month bounce is wide enough to warrant caution. But directionally, the first meaningful sequential recovery from the West in the 2026 dataset is worth noting. On an unadjusted basis, the West posted 12,000 NSA sales — up from 10,000 in August but still below the 14,000 recorded in September 2025.
The South softened modestly, falling to 413,000 SAAR from August’s 441,000 revised reading, but its year-over-year deficit is the smallest of any region at -0.7%. In unadjusted terms, the South delivered 34,000 sales — matching September 2025 exactly, making it the most stable large market in the data for the second consecutive month. The Midwest slipped to 89,000 SAAR (-8.2% YoY), while the Northeast held at 32,000 SAAR (+10.3% YoY, though confidence intervals are wide at this scale).
Year-to-date through September, the regional split has stabilized: the Northeast is now the only region running ahead of 2025 pace at +2.3%, followed by the Midwest at -0.5% and the South at -1.3%. The West remains the structural outlier at -9.2% YTD — a deficit that has moderated only slightly despite September’s sequential bounce.
Inventory: Normalization Plateauing Near Year-Ago Levels
Months’ supply edged down to 8.4 in September from 8.5 in August — but unlike the prior two months, this reading now sits slightly above the September 2025 level of 8.2. The 8.4-month reading remains above September 2025’s 8.2 months, indicating supply remains elevated despite improvement from earlier in the year.
Seasonally adjusted homes for sale fell to 476,000 from 481,000 in August and 487,000 in September 2025. The inventory estimate is lower than both August and September 2025, although the months-of-supply ratio remains slightly above its year-ago level. This suggests some easing in available inventory, not a decisive return to market balance.
Stage of Construction: Absorption Time Continues to Improve
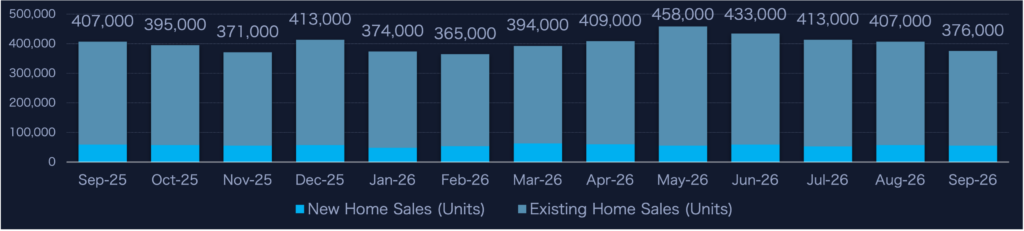
Completed homes accounted for 30,000 of September’s 56,000 NSA sales — identical to June’s reading and consistent with the pattern that has dominated 2026. Under-construction sales came in at 18,000, matching September 2025 exactly, while not-started transactions held at 7,000. Completed homes remained the largest sales category, but these figures cannot establish builders’ incentive decisions or buyers’ reasons for purchasing at a particular construction stage.
The median number of months completed homes have been on the market improved to 3.0 in September — down from 3.1 in July and August and continuing a gradual improvement from the 3.5 peak earlier in the year. A year ago, the same figure was 2.4, so absorption is still meaningfully slower than 2025 pace. But the trend is moving in the right direction, and 3.0 is the best reading of the 2026 cycle. Finished homes are moving faster than they were in the spring.
Pricing: Median Crosses $400,000 — With Important Context
The median sales price of new homes sold in September 2026 was $400,400 — up 3.9% from August’s revised $385,400 and -3.9% below September 2025’s $416,800. The average sales price was $472,800, up 0.4% from August and -6.7% below year-ago levels.
The $400,400 figure puts the median back above $400,000 for the first time since June (revised to $410,200). But the context matters: our August analysis reported a median of $393,700, and the revised figure of $385,400 is $8,300 lower. Readers comparing September’s $400,400 to August’s published figure would have calculated a +$6,700 gain; the actual revised gain is +$15,000. The reported month-to-month increase is larger against revised August data, but monthly prices reflect sampling variation and changes in the mix of homes sold.
September’s median increase interrupts the sub-$400,000 readings of July and August, but it is too early to know whether this reflects firmer pricing or a change in the mix of homes sold. Published rounded price-category shares were 20% under $300,000 and 31% between $300,000 and $399,999, totaling 51%, compared with 52% in August.
| Price Range | Units Sold | Share of Total |
|---|---|---|
| Under $300,000 | 11,000 | 20% |
| $300,000 – $399,999 | 17,000 | 31% |
| $400,000 – $499,999 | 10,000 | 19% |
| $500,000 – $599,999 | 7,000 | 13% |
| $600,000 – $799,999 | 5,000 | 10% |
| $800,000 – $999,999 | 2,000 | 4% |
| $1,000,000 and over | 2,000 | 4% |
The $800,000–$999,999 and $1M+ tiers each held at 2,000 units — flat with recent months and at the lower end of 2026 range. The concentration of activity below $400,000 continues to define the market’s structure, even as the median nominally crossed back above that level.
Market Implications Heading Into Q4 2026
September’s data closes out the third quarter with a consistent message: sales have held within a relatively narrow range since June. The SAAR has now printed within a 33,000-unit range for four consecutive months — the most sustained plateau of the 2026 cycle. The YTD deficit has held at -2.9% for two straight months. Months’ supply sits near — but not below — year-ago territory. The median moved back above $400,000, although August’s downward revision enlarged the reported month-to-month change.
None of this is alarming, but none of it is a breakout either. The conditions that produced the summer recovery — builder pricing discipline, normalized inventory, stable demand in the South — are still in place. What is less clear is whether the West’s September bounce marks the beginning of a regional turn or a single-month fluctuation in a persistently weak market. At -17.4% YoY and -9.2% YTD, the West would need further sustained improvement before a regional recovery could be established. One data point is not a trend.
The more pressing question for Q4 is whether the pricing floor has genuinely reset higher. September’s $400,400 median is the first reading above $400,000 since June’s revised figure. If October confirms that level — or moves above it — the possibility of firmer pricing would merit closer examination. If the October median retreats, September looks more like normal monthly mix variation in a market that has not yet established a consistent price direction.
The YTD trajectory suggests 2026 will finish modestly below 2025’s full-year total — but closer than the spring data implied. That is a materially different outcome than the H1 trend suggested, and it suggests sales performed better than early-year readings implied, without establishing how builder margins or incentives changed.
WHAT TO DO NOW: CHANNEL PLAYBOOKS (DATA-ALIGNED)
IF YOU MARKET DIRECT-TO-CONSUMER (DTC)
Homes priced below $400,000 accounted for 51% of September sales when the Census Bureau’s rounded price-category shares are added. For direct marketers, that reinforces the value of segmenting messages around affordability and long-term ownership costs. The higher median does not prove builder discounts are ending or that buyers should rush to act. Test practical messaging about coverage value and possible post-purchase expenses rather than predictions about home prices.
The median crossed $400K. Address affordability concerns without assuming the pricing trend is settled.
IF YOU WORK WITH REAL ESTATE AGENTS
The South recorded 34,000 unadjusted new-home sales in September, matching September 2025, while the Midwest remained near its year-earlier pace on a year-to-date basis. These regions provide useful starting points for examining new-construction referral opportunities, but national sales figures do not measure builder motivation or buyer-side negotiating leverage. Completed homes’ median time on market declined from 3.5 months earlier in the year to 3.0 in September, a possible sign of improved absorption. The West’s monthly increase merits attention, although its -9.2% YTD deficit argues against declaring a regional turnaround.
The South and Midwest are where volume is. The West showed a pulse — watch the next release before adjusting strategy.
IF YOU PARTNER WITH BUILDERS
September offers a reason to reassess local builder incentive conditions, not assume discounting has ended. The median increased, but that change may reflect the mix of homes sold. Warranty marketers can explore whether protection packages support individual builders’ sales strategies, particularly in markets with weaker sales. The West’s -17.4% year-over-year SAAR makes it a region worth investigating, but the Census data do not establish that Western builders are more receptive to these programs. Validate opportunities through local pricing, inventory, and builder conversations.
A higher median is a signal to investigate, not proof of a new pricing floor. Build relationships around measurable local needs.
Data Revision Disclosure
Housing market statistics are subject to revision as additional survey data is collected and seasonal adjustments are updated. This release revised several prior months’ figures materially. The August 2026 median sales price was revised from $393,700 (preliminary) to $385,400 — a downward adjustment of $8,300 that affects the month-over-month comparison to September’s $400,400. The August 2026 SAAR was revised from 684,000 to 680,000. June 2026 SAAR was revised upward from 672,000 to 680,000; July 2026 SAAR was revised upward from 643,000 to 647,000. The September 2026 figures are preliminary and will be subject to further revision in subsequent releases. Unless otherwise noted, this analysis reflects the most current data available at the time of publication.
Data Sources
This analysis draws on September 2026 data from:
- U.S. Census Bureau — New Residential Sales (Release CB26-174, October 27, 2026)
- U.S. Department of Housing and Urban Development
- Federal Reserve Economic Data (FRED)
About Dark Sky Data
Dark Sky Data provides housing, economic, and property intelligence designed to help home warranty providers, administrators, and real estate professionals anticipate demand, segment markets accurately, and allocate resources with confidence.